Breaking Down the Caps Series
Diving into some of the numbers from Round 1 and how they benchmark against the regular season performance.
The Round 1 Series against the Capitals felt good, no it felt great. There was a big sigh of relief knowing the Rangers took care of business against a team that was definitively the worse team. While the Rangers showed signs and long stretches where they showcased their offensive power, they were far from perfect, specifically on defense and the numbers reflect both sides.
Let's start with showcasing the basic breakdown of the performance. They won 4 thanks to the power play, and there's nothing wrong with that as it's wise to build a team that has a very capable power play. After all, each team in the NHL averaged over 3 penalties taken per game in the regular season and at least 2 5v4 opportunities per game. The Rangers scored 15 goals, less than half of which were at even strength, and 104 shots on goal, 71.1% of which were at even strength. For context, the Rangers had 81.1% of their SOG at even strength during the regular season and out of all teams in the playoffs, 71.1% is second to last just ahead of the Edmonton Oilers (70.5%). This isn't necessarily a bad thing, it's just important to acknowledge from where the chances are coming. If they aren't able to draw penalties in future games, we know why they may get outshot.
** The NHL has added an extra SOG to NYR in Game 2 and an extra SOG to WSH in Game 3 after the game **
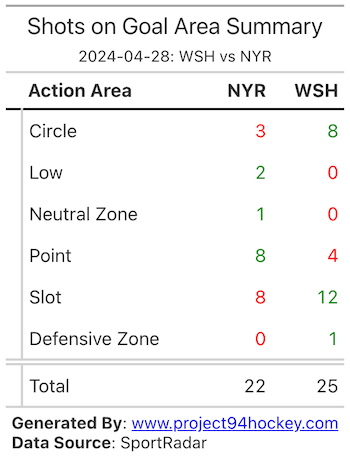
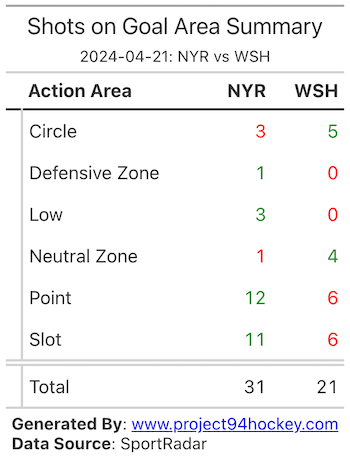
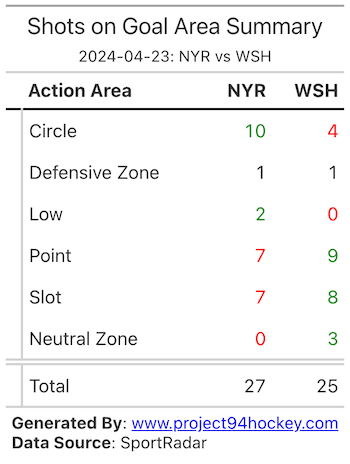
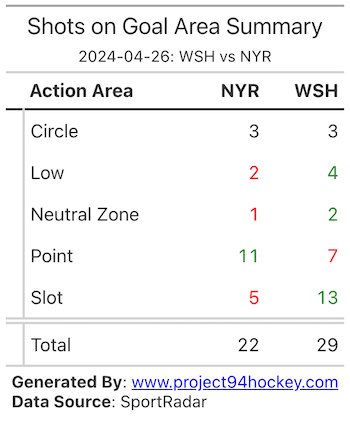
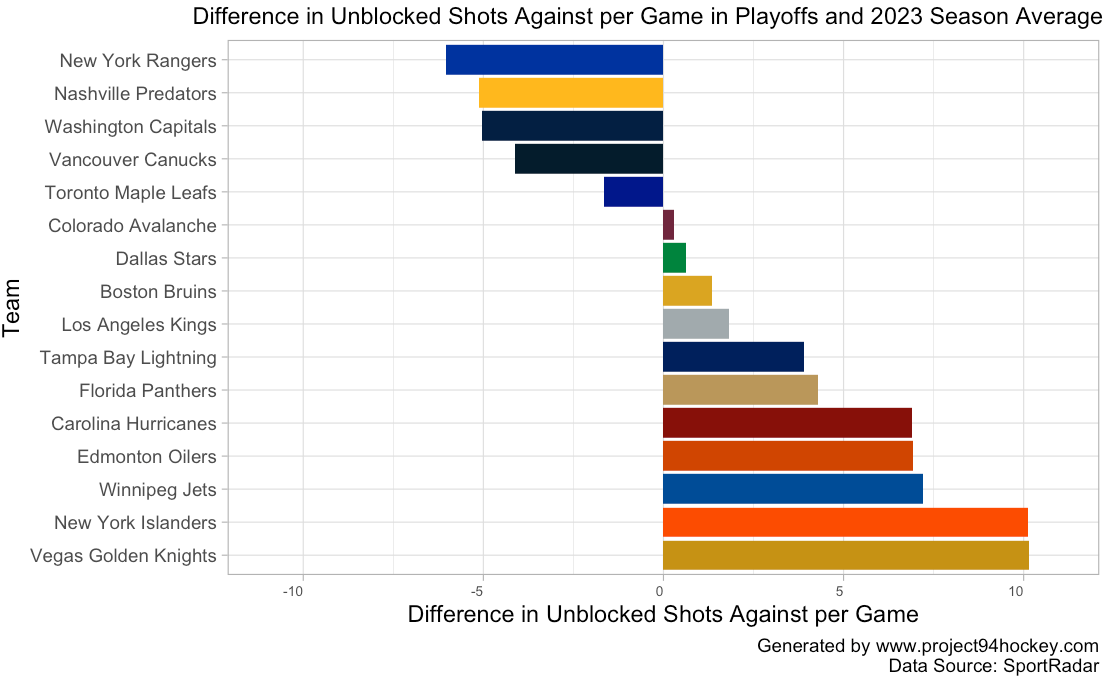
Defensively, they were outshot in 2/4 of the games (by SOG) and had fewer SOG from the slot in 3/4 games. That's the type of number that scares me against high scoring and volume shooting teams. While they limited the Caps to 4 fewer SOG than their opponents' average in the Regular Season, they still allowed solid scoring chances, particularly in Game 3. It's also interesting that they actually generated fewer Unblocked Shot Attempts each game of the series than the Regular Season.
So apart from team shots and team scoring, which skaters stood out for the Rangers in the series? The first one that jumps out is Vincent Trocheck, specifically his essential role from the face-off circle. I will continue to break this down further by face-off location at a later time, but Trocheck was 76.9%, 68%, 75%, and 68.4% at face-offs, in respective game order. In games 1-3, Trocheck was 75% or greater for face-offs on the power play and 80% from the offensive zone at all situations in Game 3. Roslovic, Zibanejad and Trocheck all had over 4 Points/60, which was great to see as the 3 combined for 42 unblocked shots and 6 goals.
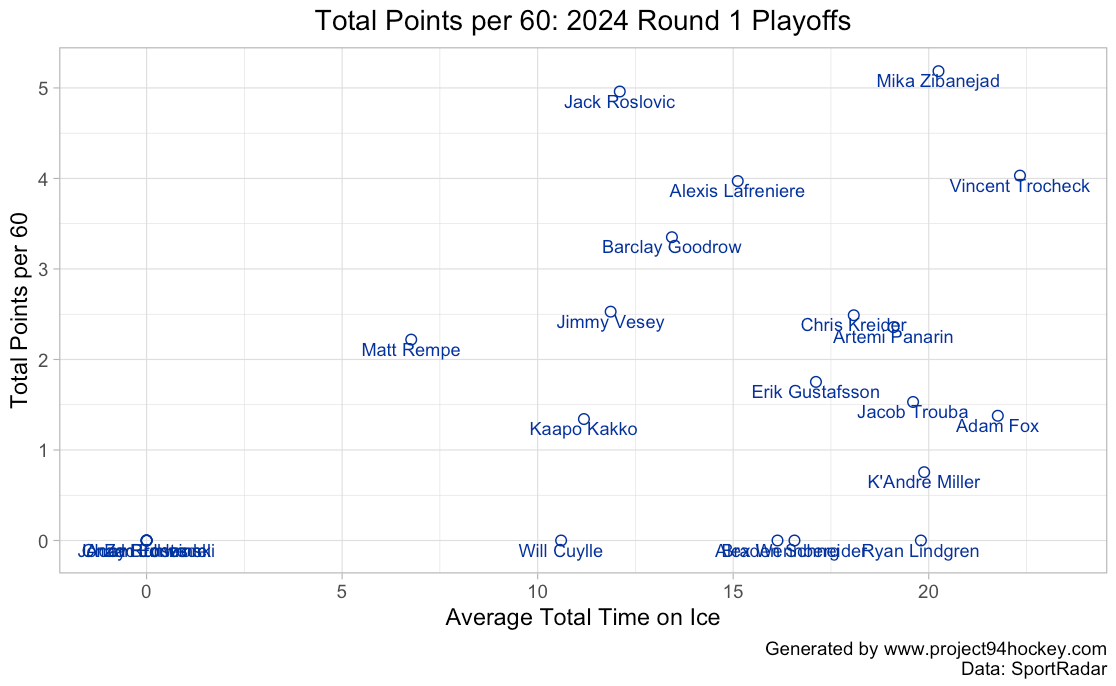
If you aren't familiar with "Per 60" metrics, they take a statistic like Points, divide it by the player's total time on ice, and multiply by 60 minutes. This helps give a baseline for all players so we can answer, "If each player were to play 60 minutes, they would have __ Points." I personally like this statistic for on-ice and shot attempt statistics as it helps show who can produce chances with their respective time on the ice. In the chart above, the top left are the players making the most with their time by Producing the most points with fewest TOI, and in the top right are the players playing many minutes and scoring the most.
On that note, it was nice to see Kaapo Kakko step up his game and generate chances, as he increased his Unblocked Shot Attempts per 60 from the regular season. Last but not least, Trouba had a strong series, leading the Rangers with On-Ice Takeaways (16) and was only on the ice for 2 goals against.
The Rangers certainly showed, which they proved all season, they don't always shoot the most but they are going to capitalize on their chances, especially with a 37.5% Power play percentage.
