Goalies are Voodoo...But Improving Comparative Analysis Tools Can Help
Introducing 5v5 adjGSAA/60. This is longer than anticipated. What can I say, I haven't written in a while. Take breaks.
There is an ever-present notion in the hockey analytics community regarding goaltender analysis. Basically, and to the point – it is widely acknowledged that the tools are inadequate.
A plethora of modern statistics and modalities of analysis developed by mostly bloggers, statisticians, and hobbyists from all backgrounds - as well as fantastic stats sites like war-on-ice.com and hockeyanalysis.com, have shed new light on numerous areas of the game. But goaltending analysis still lags behind. This isn't because of any particular failing or lack of interest. There is no doubt that the position itself, and factors that determine or affect success in it, are difficult to pin down.
It is definitely getting better. The mainstream media, casual fans, and hardcore fans are recognizing that goals against average and wins are unreliable and flawed measures of how well a goalie is performing. I wrote an article about a year ago suggesting that there are better ways to compare and analyze goaltending success.
Shortly after that, the folks at War-On-Ice introduced "zones of danger," scraping data directly from NHL game sheets to effectively break up the ice by save percentage, helping illuminate the types of shots goalies are facing and how successful they are at stopping them (adjusted save%). Several months ago, Conor Tompkins, who writes on his blog Null Hypothesis from time to time, tweeted out several interesting charts showing how the high danger shot type correlates most closely to traditional sv%. Matt Cane of Puck++ then wrote an article about using danger zone shot volume to better predict future save%. Steve Burtch and I came at the problem of comparing replacement level or average performance in certain situations and trying to hammer down who is actually performing better than whom. Steve identified high danger shots as key because the difference in high danger save% is what primarily distinguishes the elite from the average.
The purpose of this article is to establish a clear and easily used baseline comparative tool that makes it easier to look at a list of goalies and determine as definitively as possible, regardless of circumstance, and in consideration of the tools we have and the variables we can actually account for, Goalie A is performing better than Goalie B. On the ol' Twitter machine back in January through March, I identified performance above average as key.
Goals Saved Above Average (GSAA) is hardly a new concept. I have used it in my own instruction since 2001. But I wanted to further refine the metric to better illuminate who is performing best given their circumstance, based on shot danger zone. That is the sole purpose of this introductory article on the topic.
5v5 save percentage and dividing sv% by danger zone (area of the ice where the shot is taken) are certainly solid and straight-forward improvements that help level the comparative playing field. For the uninitiated I strongly recommend visiting the War-On-Ice site and its blog to review the concept of shot danger zone and everything that has come after. But if you can't be bothered here it is in a nutshell:
Location-based shot data is drawn directly from the NHL and adjusts overall save percentage to account for empirical differences in shooting percentages across three distinct shooting "zones," as visualized below. From War-On-Ice:
NHL goaltenders do not compete on a level playing field: In any given game, some goaltenders face many difficult, close-range shots, while others face many easy, long-range shots. To account for this, we use "Adjusted Save Percentage", which takes into account the ‘quality’ of each shot they face based on the empirical league-wide shooting percentage from that area of the ice.
courtesy: war-on-ice.com
A Quick Brush-up on GSAA:
Goals Saved Above Average (GSAA) has kind of been ignored by the modern stats community, but a few fixes can make it very valuable. The stat represents the number of goals a goalie saves for his team above (or below) league average. It's really simple. Basically, take the league average sv% and apply it to the total shots faced by the particular goaltender. Out of that, you get a number of goals that the average goaltender would have given up had he faced the same number of shots as the goaltender in question.
This resulting number can be compared to the number of goals the goaltender in question actually gave up. A plus/minus is the result. If a goalie is in the positive, he is saving more than a league average goaltender might in the same situation. If the goalie is in the minus...well you get the idea.
At first it might appear like this is simply a comparison of save percentages, or akin to it. But it isn't. GSAA creates a direct comparison to league average, as opposed to a stand-alone percentage. Why is that good? Because, as mentioned above, league average SV% and GAA changes year to year. It is hard to look at either stat alone and arbitrarily determine whether it's good or not as to compared to the goaltender's peers that season. With GSAA, the assumption at a glance is that the goaltender in question is performing better or worse in comparison to the league average that season. It is a hard and fast number. And that's nice.
Improving GSAA Using Danger Zones and Per 60 Min Rate:
The inherent flaw in GSAA is that it favors certain goalies who play more than others because it is cumulative, like +/-. If you're good and play a lot you will shine. If you're good but don't play as much, you will look average. The way to fix this is to turn it into a per 60 minutes rate stat.
Further, GSAA considers all situations the same. So goalies who don't face tough shots, and don't face as many PKs, will look better than goalies who get peppered in high danger areas and have ill-tempered teammates hanging them out to dry.
First, let's remove the white noise of special teams altogether. It accounts for a disproportionately small amount of time but can truly inflate goals against totals. Let's make it 5v5, like other modern rate stats are typically viewed.
Now, let's incorporate weighting by danger zone. This is done quite simply by applying the league average sv% in each zone to the types of shots faced by the particular goalie. Out of that, you get the number of goals that an average goalie would give up in each zone if that average goalie had faced the workload of the goalie in question.
The resulting stat, 5v5 adjGSAA/60, thus gives us a much better picture of how much better, or worse, the goalie in question has done than an average goalie would have, had he faced the same danger zone workload.
The league wide 5v5 sv% by danger zone (rounded) in 2014-15 was as follows:
High Danger: 83.52%
Medium Danger: 92.61%
Low Danger: 97.38%
Using these let's now take a look at last season's 5v5 adjGSAA/60 (min. 1200 TOI):
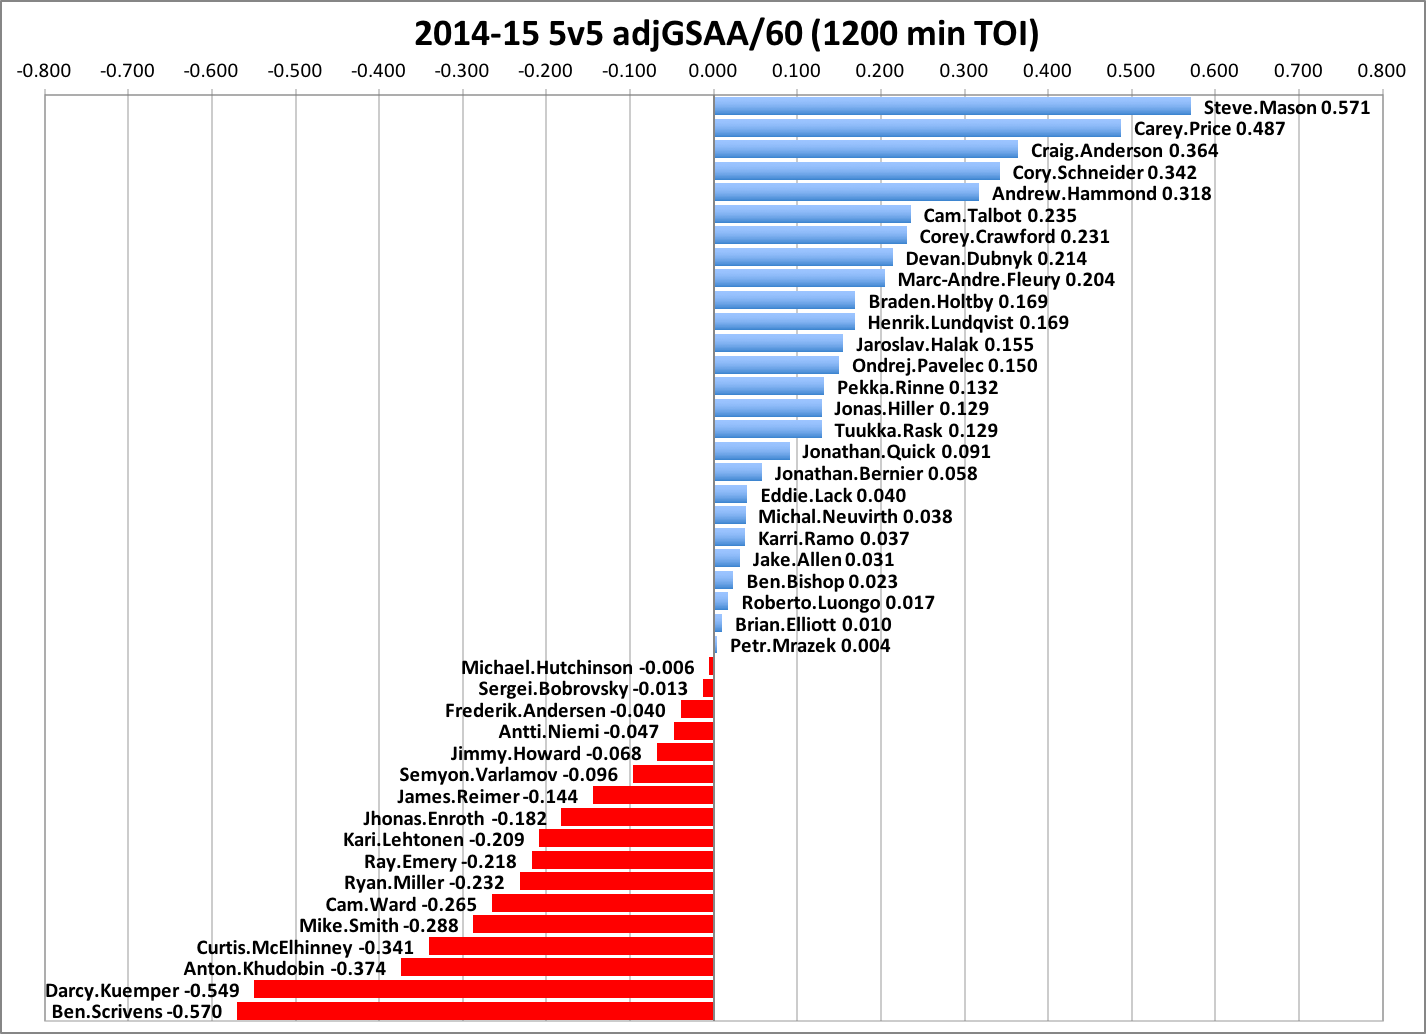
I chose the TOI minimum of 1200 minutes, or 20 full games, somewhat arbitrarily. I wanted to get guys that played at least a quarter of their team's season.
Carey Price is predictably near the top and every other statistic we use supports his presence at the top. This comes as no surprise. The point of this stat isn't to necessarily surprise, but to illuminate and make it easier to compare his performance against his peers. Just how well did he perform, game in and game out? About a half a goal better than if an average goalie were in his shoes.
What may come as a surprise to some is just how well Steve Mason played in his 51 games this past season. He got dumped on thanks to a porous defense, and he performed at an elite level under the pressure. I have been banging the Craig Anderson and Cory Schneider drum for several seasons now, and they do not disappoint either. Talbot performed very well. Hank was Hank, but maybe not quite as good as vintage Hank.
Let's look at 3 year rates (min 3000 TOI):
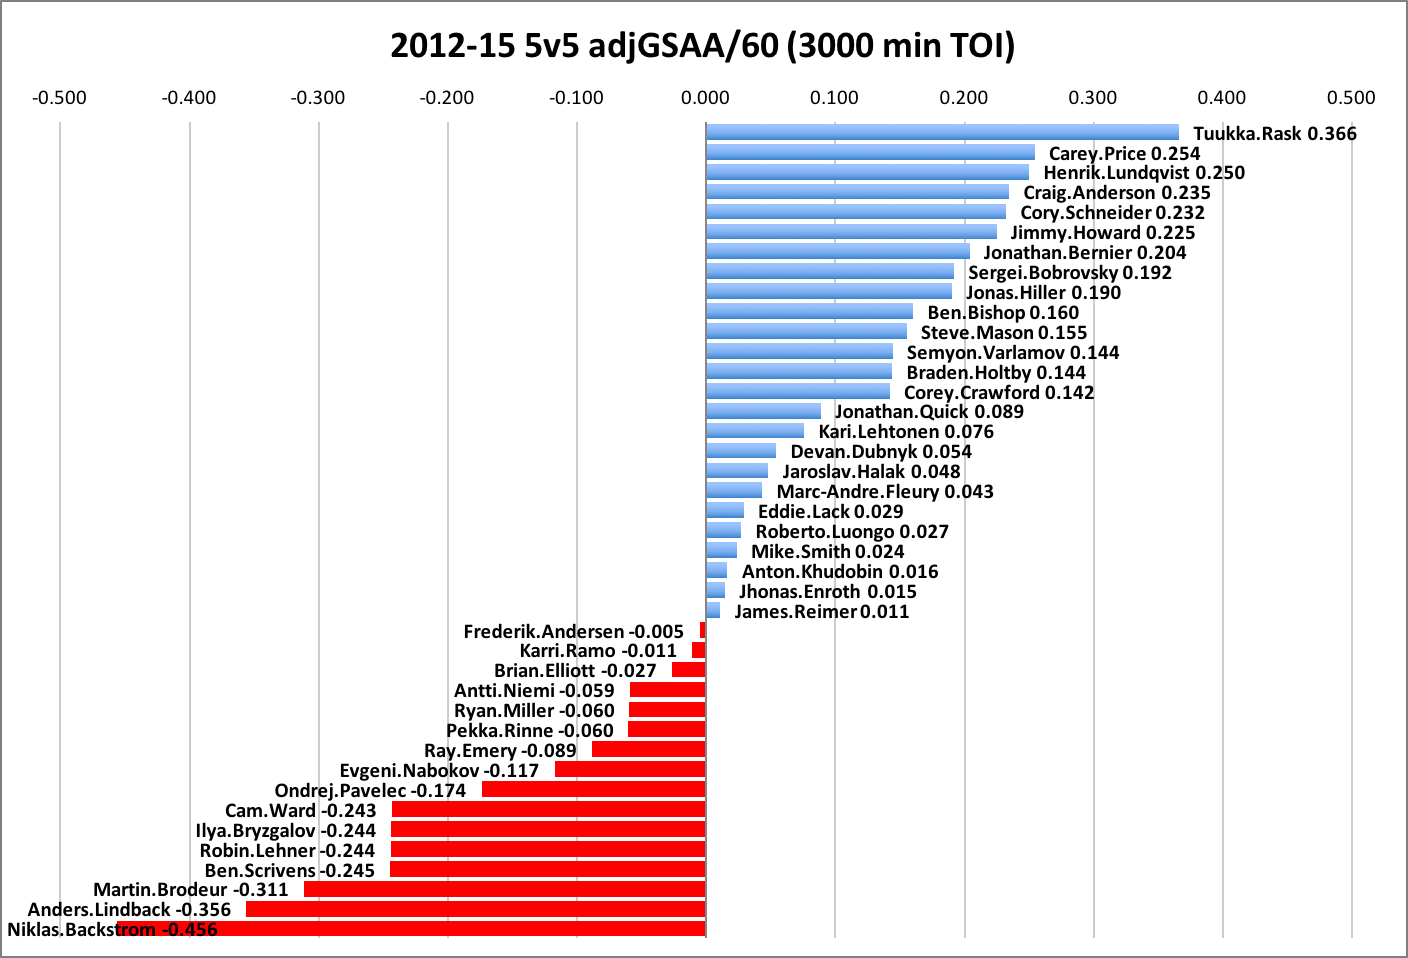
Again, the minimum TOI is intended to get a cross section of goalies that have had a decent fill of time in net. 50 games or more, to be exact. You'll see Rask, Lundqvist and Price rightfully at the top. Anderson, Schneider, Howard, Bernier, and Bobrovsky are all right there as well and that isn't a mistake. They are all excellent, yet underrated performers. Despite Howard's recent struggles last season, he has been fairly steady. Bernier gets shelled on a regular basis, but performs much better than an average goalie would in his shoes.
adjGSAA/60 doesn't like Pekka Rinne and Ryan Miller, and that may surprise some folks. But the reality is that Rinne has benefitted from a great defense and has not distinguished himself despite that. The perception is that because Nashville has traditionally played low scoring hockey, he is the primary reason. This may not be the case. He did have an injury-riddled stint in this three year span, so it is worth giving him benefit of doubt. Miller, on the other hand, has been on a steady decline for the past three years. He is well past his prime and may have benefitted, at least in perception, from a few amazing seasons earlier in his career and the general consensus that Buffalo did him no favors. Despite that perception, he has never really distinguished himself as any better than a top 10 or so goaltender. That is a good place to be, but I wouldn't consider it necessarily elite, season over season. The next chart will show that.
2005-15 adjGSAA/60 (min 15,000 TOI or about 246 full games)
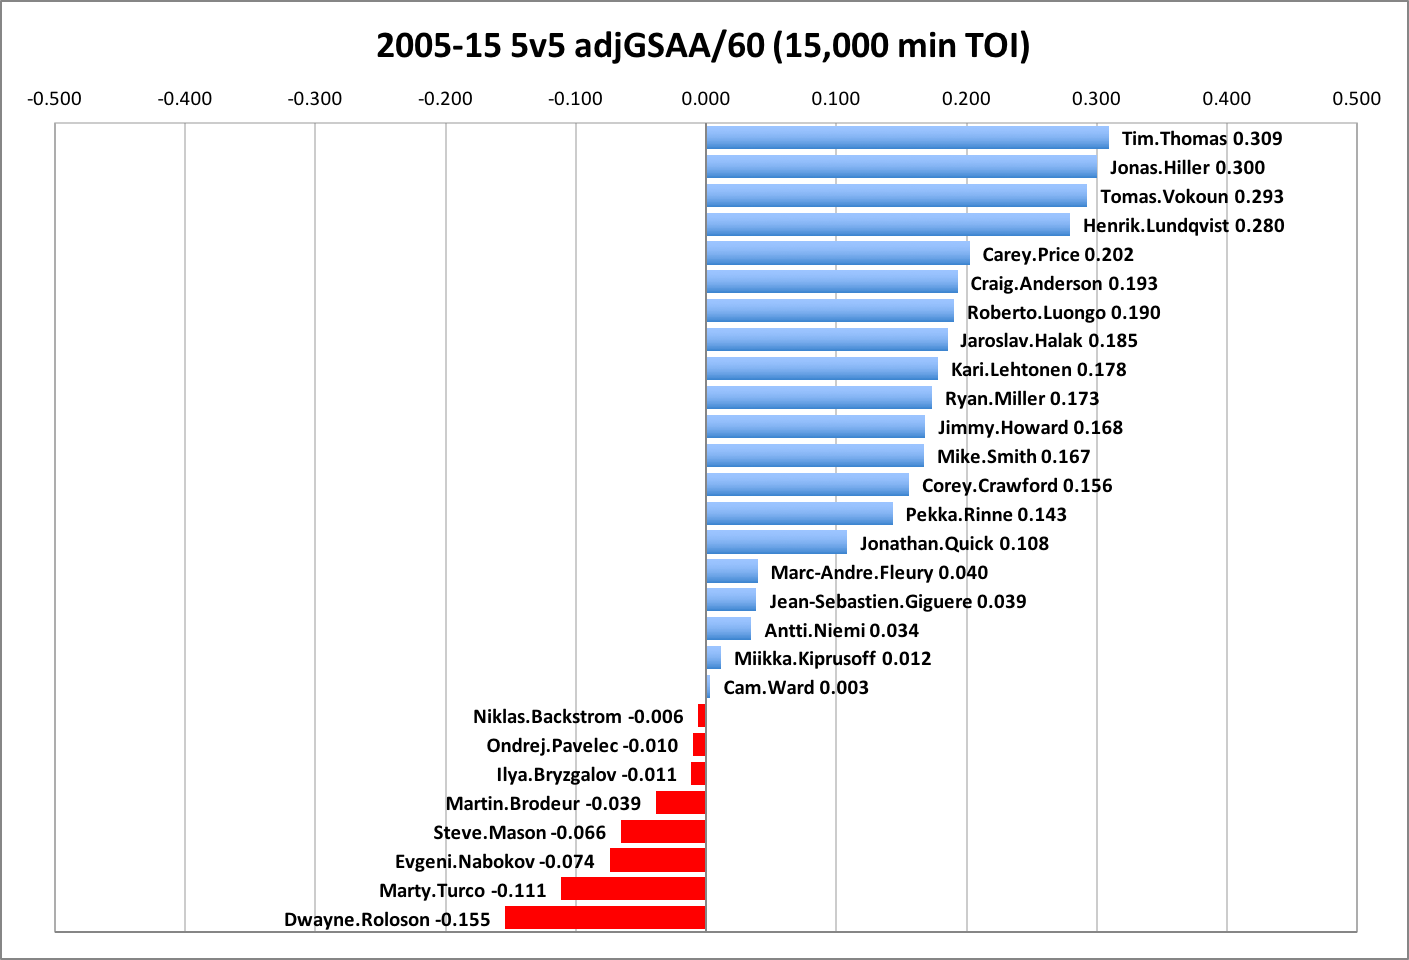
Again, the TOI minimum is relatively arbitrary, but I wanted to show goalies that got a prolonged role as a starter for a number of seasons during that time. The first thing you will notice in this ten year view is that there aren't many who have lasted long enough, and that most of the goalies that do come out at or above average. Logically, goalies that get a chance to play a lot of games over a longer span of time are probably better than average.
One issue with the long view is that it tends to misrepresent consistent performance. Certain guys, like Tim Thomas, had several absolutely amazing years. But they were either not given a chance, or could not perform well enough, to do it for an extended period of, say, 8 or 9 years straight.
This probably reaffirms the "goalies are voodoo" mantra. It is really hard to find a guy who can do it at the same level every year. That is where a goalie like Lundqvist makes his name. He may not be #1 each season. But he is right at the tippy-top every single year. And this alone makes him worthy of consideration as the best of a generation overall. It is an amazing feat to be as good as he has been every single year on a consistent basis. I'll get more into this in future articles on the subjects of predictivity, longevity and consistency.
Next Steps
I consider 5v5 adjGSAA/60 a baseline for future refinement. One issue I can easily recognize and that is fair to scrutinize is the fact that there is no consideration for year over year reliable predictivity. Not that it cannot be accomplished. It simply isn't presented here. But it is coming.
From here, I would like to get more in-depth, borrowing some concepts discussed by the folks at war-on-ice in their Road to WAR series such as incorporating variables for team, defensive performance, zone entry data, venue, trackable shot quality considerations, etc. @garik16, who writes at Lighthouse Hockey and Hockey-Graphs, has also introduced Hockey Marcels to forecast goaltending performance, and I would love to see how the concept could blend with a comparative tool like adjGSAA/60.
Manual tracking of goaltenders is beginning to delineate what stylistic decisions and/or actual performance abilities, as well as what circumstances around the goaltender, may impact success. A perfect example is Steve Valiquette’s "Royal Road," which puts a name and data analysis to an age-old tactic of forcing goaltenders to move laterally via puck-moving across the middle of the ice. But until we have larger samples of hard data, it is difficult, if not inappropriate, to utilize any statistics arising from that data to compare and contrast goaltender performance.
But let's not overcomplicate things more than this 5000 word article already has. The goal is to continue changing the standards for comparing goaltender performance. It would be overwhelming, in my opinion, to perfect it all at once. I believe 5v5 adjGSAA/60 is a great way to easily compare goalies much more concretely than sv% alone can and should be a mainstay in the lexicon of fans around the water cooler. Catchy acronym be damned.
All statistics from http://war-on-ice.com