New York Rangers Stats: Individual Chances Update
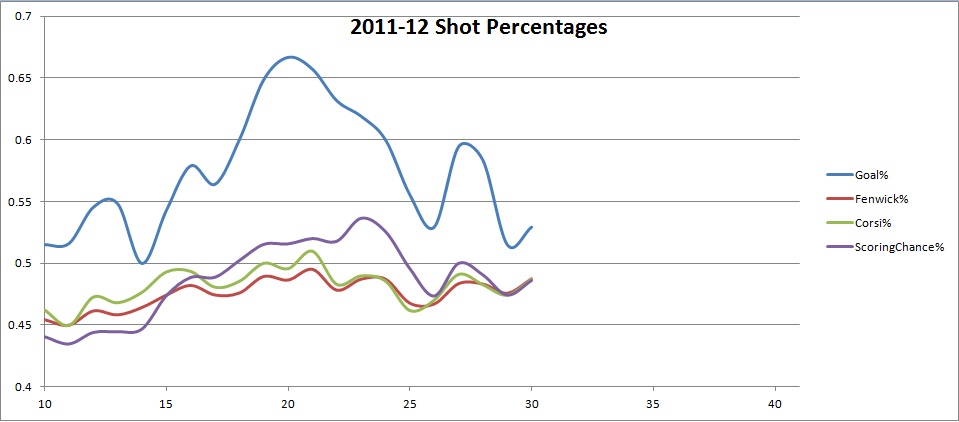
It's been a while since the last individual update, so the New Year seems like as good a time as any for the next one. For previous updates, I gave you the game by game totals, but 20 games is a lot to list, so this time around I'll just give the totals. Those curious enough to see the game logs can find it at my blog like data dump site. We saw in my shots update that the chances did trend above break even for a period of time, but they've come back down now.
| Totals | EV | PP | 5v3 PP | SH | 5v3 SH | |||||||
| Previous Total | 241 | 243 | 170 | 176 | 54 | 11 | 10 | 0 | 7 | 53 | 0 | 3 |
| Update Total | 287 | 309 | 223 | 240 | 53 | 7 | 3 | 0 | 9 | 56 | 0 | 5 |
| Season Total | 528 | 552 | 393 | 416 | 107 | 18 | 13 | 0 | 16 | 109 | 0 | 8 |
*Data does not include the Winter Classic
Scoring chances for the season are still below 50%, much like the season shot totals that Rob L showed. What that tells is that contrary to some arguments, there's no noticeable difference in the shot quality being prevented by the defense, or created by the offense. Another way we can check that is by type of chance. (5v5 data only)
| Chances For | Chances Against | |||||||
| Chances | COG | Goals | Chance% | Chances | COG | Goals | Chance% | |
| Breakaways | 9 | 8 | 3 | 33.33% | 4 | 4 | 1 | 25.00% |
| Even Man Rush/Transition | 125 | 98 | 17 | 13.60% | 146 | 115 | 17 | 11.64% |
| Odd Man Rush | 26 | 15 | 10 | 38.47% | 27 | 20 | 7 | 25.93% |
| Zone Entry Totals | 160 | 121 | 30 | 18.75% | 177 | 139 | 25 | 14.12% |
| Defensive Zone Turnover | 44 | 37 | 9 | 20.45% | 45 | 36 | 7 | 15.56% |
| Zone Pressure/Forecheck | 146 | 111 | 24 | 16.44% | 167 | 129 | 12 | 7.19% |
| Faceoffs | 17 | 15 | 2 | 11.76% | 19 | 17 | 5 | 26.32% |
| Zone Pressure Totals | 207 | 163 | 35 | 16.91% | 231 | 182 | 24 | 10.39% |
The New York Rangers have gotten a few more breakaways (thank you Marian Gaborik), but overall there's no discernible difference in the types allowed, and the percentage of transition chances of the two groups (43.6% for, 43.4% against) is virtually identical. The main separator, which also accounts for their record, is once again the goaltending of Henrik Lundqvist and Martin Biron. After stopping 88% of even strength chances against last year, the duo has maintained that clip through 36 games this year.
After the jump, the individual data.
| Name | Chance | COG | Goal | Chance% | Assists | Plays | C/60 | P/60 | Attempts | SC/ATT |
| Richards | 35 | 26 | 9 | 25.71% | 24 | 59 | 3.82 | 6.44 | 87 | 40.23% |
| Callahan | 30 | 24 | 2 | 6.67% | 24 | 54 | 3.43 | 6.18 | 91 | 32.97% |
| Gaborik | 62 | 51 | 15 | 24.19% | 21 | 83 | 7.15 | 9.57 | 107 | 57.94% |
| Stepan | 35 | 26 | 5 | 14.29% | 36 | 71 | 4.36 | 8.85 | 75 | 46.67% |
| Dubinsky | 35 | 24 | 4 | 11.43% | 11 | 46 | 4.61 | 6.07 | 79 | 44.30% |
| Fedotenko | 24 | 22 | 4 | 16.67% | 8 | 32 | 3.27 | 4.36 | 53 | 45.28% |
| Anisimov | 29 | 20 | 4 | 13.79% | 20 | 49 | 4.13 | 6.98 | 67 | 43.28% |
| Boyle | 27 | 16 | 2 | 7.41% | 13 | 40 | 3.91 | 5.80 | 79 | 34.18% |
| Prust | 13 | 12 | 1 | 7.69% | 17 | 30 | 2.34 | 5.39 | 27 | 48.15% |
| Hagelin | 11 | 9 | 4 | 36.36% | 8 | 19 | 3.06 | 5.29 | 45 | 24.44% |
| Mitchell | 9 | 6 | 1 | 11.11% | 2 | 11 | 2.63 | 3.21 | 26 | 34.62% |
| Christensen | 3 | 2 | 0 | 0.00% | 3 | 6 | 1.34 | 2.69 | 11 | 27.27% |
| Avery | 8 | 7 | 3 | 37.50% | 2 | 10 | 4.57 | 5.71 | 22 | 36.36% |
| Rupp | 3 | 3 | 1 | 33.33% | 0 | 3 | 2.04 | 2.04 | 4 | 75.00% |
| Wolski | 4 | 3 | 0 | 0.00% | 4 | 8 | 3.61 | 7.21 | 8 | 50.00% |
| Deveaux | 1 | 1 | 0 | 0.00% | 1 | 2 | 1.28 | 2.56 | 3 | 33.33% |
| TOTAL | 329 | 252 | 55 | 16.72% | 194 | 523 | 11.32 | 17.99 | 784 | 41.96% |
| Name | Chance | COG | Goal | Chance% | Assists | Plays | C/60 | P/60 | Attempts | SC/ATT |
| Girardi | 3 | 2 | 1 | 33.33% | 15 | 18 | 0.25 | 1.48 | 45 | 6.67% |
| McDonagh | 12 | 9 | 3 | 25.00% | 13 | 25 | 1.02 | 2.12 | 54 | 22.22% |
| DelZotto | 10 | 9 | 3 | 30.00% | 7 | 17 | 1.02 | 1.74 | 47 | 21.28% |
| Eminger | 5 | 5 | 2 | 40.00% | 3 | 8 | 0.86 | 1.38 | 22 | 22.73% |
| Sauer | 4 | 3 | 0 | 0.00% | 4 | 8 | 0.80 | 1.60 | 18 | 22.22% |
| Woywitka | 1 | 1 | 1 | 100.00% | 3 | 4 | 0.23 | 0.92 | 17 | 5.88% |
| Stralman | 1 | 1 | 0 | 0.00% | 2 | 3 | 0.29 | 0.88 | 17 | 5.88% |
| Erixon | 1 | 1 | 0 | 0.00% | 1 | 2 | 0.38 | 0.77 | 8 | 12.50% |
| Bickel | 1 | 1 | 0 | 0.00% | 2 | 3 | 0.96 | 2.89 | 7 | 14.29% |
| Bell | 0 | 0 | 0 | 0.00% | 1 | 1 | 0.00 | 5.25 | 4 | 0.00% |
| TOTAL | 38 | 32 | 10 | 26.32% | 51 | 89 | 1.31 | 3.06 | 239 | 15.90% |
*5v5 data only. Players initially sorted by ES TOI. Columns are sortable by clicking the headers.
Much like the first two updates, it's still Marian Gaborik, and then everyone else. His pace has slipped, but he still gets more than 2.5 more chances per 60 minutes than his nearest teammate. That teammate is the much maligned Brandon Dubinsky. Dubinsky was strong by this measure the last time, but his improving play has come with an improving rate of chances. When it comes to total involvement though, the other half of the Rangers' dynamic duo, Derek Stepan, is second in command. His team leading 36 chance-assists are 50% more than the next best Ranger player, exemplifying his ability as a playmaker.
Defensively, not much has changed since last update. The defense as a whole is contributing a bit less, from 3.72 plays per 60 down to now 3.06. Relative to each other, the order is basically the same. The biggest surprise on the list has to be our resident rugrat, Stu Bickel. Primarily here for his grit, Bickel has chipped in a fair amount of offense for his time here. He's not likely to keep up with Ryan McDonagh and Michael Del Zotto, but his contributions have been a pleasant surprise thus far.
One thing I added for this update is the SC/ATT column. Very simply, this is the percentage of a players' shots that were marked as scoring chances. This includes not just shots on goal, but missed nets as well. The shot data comes courtesy of the fine folk at behindthenet.ca, Gabe Desjardins. Of course, Marian Gaborik leads that list as well, but more interesting than the top of the list are two names at the bottom, Ryan Callahan and rookie Carl Hagelin.
Both players clearly substitute quality for quantity. That's not necessarily a bad thing, getting pucks on net from anywhere rarely is. The issue lies in conversion. In Callahan's case, it hasn't mattered much. He has a 4 even strength goals from non-chance areas, so his conversion on actual chances is pretty poor. That number should come up with time, which means even if he stops scoring from sharp angles, his goal production may stay fairly steady. In Hagelin's case, however, we see him converting at a somewhat obscene rate. His speed has allowed him to score on odd man rushes, which definitely helps, but he's not likely to keep shooting 36% from the chance area. That will be something to note when his goal production inevitably drops a bit.
The final table here is for the power play (5v4 only):
| Name | Chance | COG | Goal | Chance% | Assists | Plays | C/60 | P/60 | Attempts | SC/ATT |
| DelZotto | 5 | 2 | 0 | 0.00% | 18 | 23 | 1.96 | 9.02 | 13 | 15.38% |
| Richards | 14 | 8 | 3 | 21.43% | 18 | 32 | 5.80 | 13.27 | 24 | 33.33% |
| Callahan | 12 | 10 | 5 | 41.67% | 7 | 19 | 5.63 | 8.92 | 18 | 55.56% |
| Gaborik | 33 | 24 | 4 | 12.12% | 6 | 39 | 16.03 | 18.95 | 31 | 77.42% |
| Stepan | 11 | 7 | 2 | 18.18% | 8 | 19 | 5.97 | 10.31 | 14 | 50.00% |
| Girardi | 1 | 1 | 1 | 100.00% | 9 | 10 | 0.72 | 7.25 | 11 | 9.09% |
| Dubinsky | 7 | 3 | 0 | 0.00% | 3 | 10 | 5.43 | 7.75 | 4 | 75.00% |
| Anisimov | 5 | 5 | 2 | 40.00% | 4 | 9 | 4.79 | 8.62 | 12 | 41.67% |
| McDonagh | 1 | 0 | 0 | 0.00% | 3 | 4 | 1.70 | 6.80 | 3 | 0.00% |
| Boyle | 5 | 4 | 0 | 0.00% | 0 | 5 | 9.69 | 9.69 | 7 | 57.14% |
| Christensen | 1 | 1 | 0 | 0.00% | 1 | 2 | 2.65 | 5.31 | 1 | 100.00% |
| Fedotenko | 3 | 2 | 1 | 33.33% | 1 | 4 | 9.80 | 13.07 | 3 | 66.67% |
| Mitchell | 2 | 2 | 0 | 0.00% | 1 | 3 | 16.26 | 24.39 | 2 | 100.00% |
| Wolski | 0 | 0 | 0 | 0.00% | 1 | 1 | 0.00 | 9.43 | 1 | 0.00% |
| Zuccarello | 0 | 0 | 0 | 0.00% | 1 | 1 | 0.00 | 12.20 | 0 | 0.00% |
| Prust | 1 | 1 | 0 | 0.00% | 0 | 1 | 16.67 | 16.67 | 1 | 100.00% |
| Hagelin | 0 | 0 | 0 | 0.00% | 1 | 1 | 0.00 | 22.22 | 0 | 0.00% |
| TOTAL | 101 | 70 | 18 | 17.82% | 82 | 183 | 28.6 | 51.9 | 145 | 48.28% |
SC/ATT here does not include missed nets. Table again is sortable.
In a lot of ways, it's hard not to see why the PP has been streaky this year. It really is Gaborik and everyone else. While Gaborik averages a chance about every 3.75 minutes, the rest of the first unit gets one every 10-12 minutes. It takes 5-6 power plays for each to record a single chance, which then only has about a 15% chance of succeeding, give or take. To obtain more success going forward, they will need another power play threat to emerge. Options internally may include Brian Boyle (5 chances in 30 minutes) or even John Mitchell (2 in 7 min). With both of those players unlikely to become heroes, this may be an area to be addressed at the deadline.
Thoughts?
Special thanks as always to Vic Ferrari, whose script makes generating all this data a piece of cake.
