New York Rangers Stats: Shooting Trends
Fellow Banter author Rob L. has done an excellent job keeping fans updated on the performance of this Rangers team according to shot metrics. As a follow up to his work, I wanted to give a more visual look at those the season has trended thus far. For starters, let's look at last year's team.
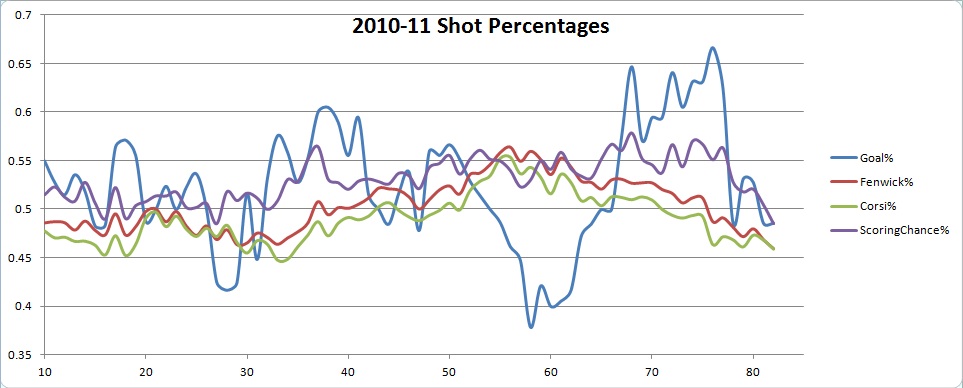
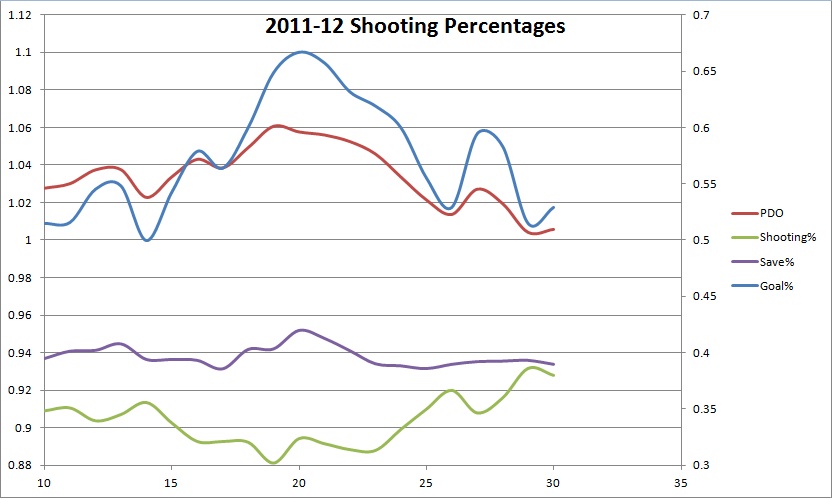
The chart (click to enlarge) represents a rolling 10 game average of each of the 4 indicated categories. The data is for even strength only. For instance, between games 50 and 60 last year, the Rangers got only 40% of the goals scored, while between 60 and 70 they were just under 60%. Ordinarily, I would use a 20 game average to smooth the data a bit, but since we have just 30 games for comparison this season, it wouldn't give us very many data points.
Though a bit cluttered, you can see that during the course of the year, the Rangers' shot metrics stayed relatively bunched all season. When Fenwick (Shots For / Shots By Both teams, excluding blocked shots) and Corsi (Fenwick + blocked shots) went up, so did their scoring chances. However, goals% was a lot more volatile. This is because over the course of the season, there is a tremendous amount of luck involved in goal scoring. That luck is captured by looking at PDO.
PDO is a simple statistic, just the sum of a team's shooting percentage and their save percentage. Some argue it's the single most important to understand. Over the course of a season, PDO will regress towards 100%, but as you'll see, on the small scale, it coincides pretty well with goal%:
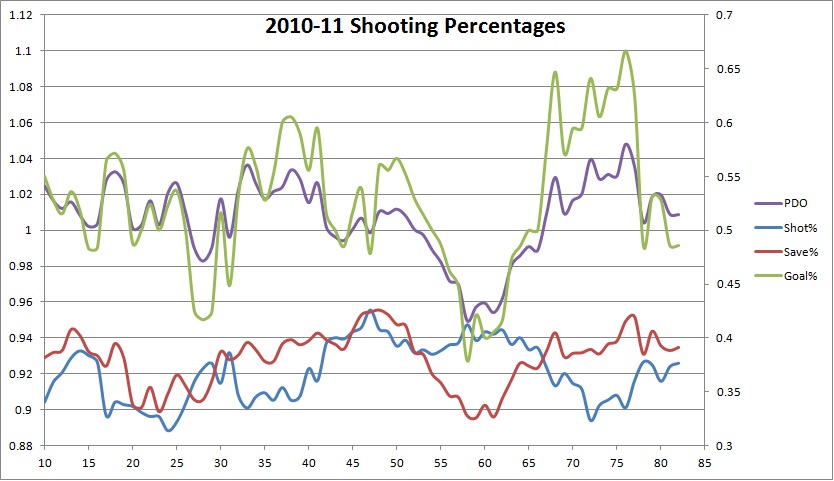
For help reading the chart a bit, goal% is plotted against the axis on the right, while PDO and it's components are plotted on the left axis. Shot percentage here (in blue) is shown as opponents save percentage. You can see that goaltender performance, both for (red) and against, goes through peaks and valleys over the course of the season. When things go bad, so does the goal differential, and only special teams or incredible luck can bail a team out. Thus far, that hasn't happened to the Rangers.
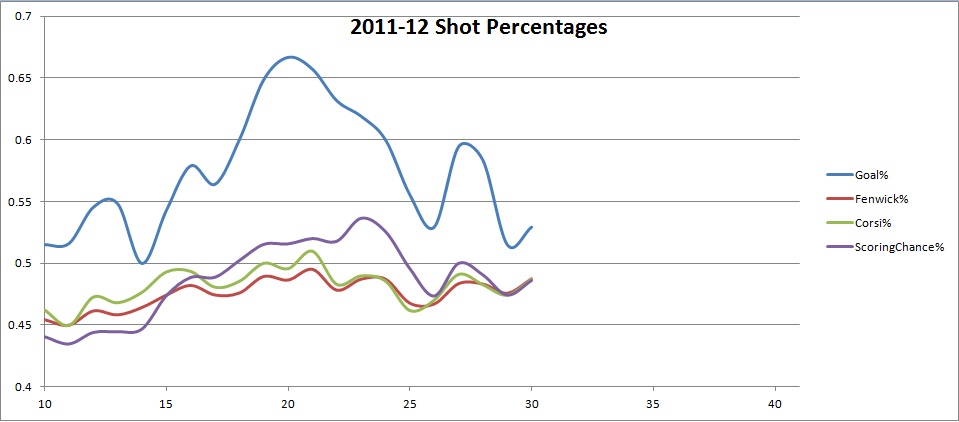
Unlike last year when goals mostly followed along, just with a lot more volatility, this year the Rangers goals have been far more frequent than the shots would indicate. Quality may play a small role, as scoring chances outpaced traditional shots during the course of November onwards. It definitely does not explain getting upwards of 65% of the goals scored. No, instead you can thank Henrik Lundqvist and Martin Biron for that:
Thus far, the team's save percentage has been steady as she goes, staying around an excellent 94% at even strength for the entire season. The goalies were able to maintain that level of play last year for stretches of 20 games, so it's not out of character. Nevertheless, one has to be concerned that the drops down to the 90% level will show up at some point this season. When it does, one hopes it comes when the offense is on another of their hots streaks. They had such a run early, but you can see the 'puck luck' starting to turn over. Converting 11-12% of their even strength shots simply was not something that was going to continue.
In any single game, special teams or a couple of bounces either way can decide a game. Long term success depends on the team getting shots and preventing them. So far, they've been below average in that regard, but improving. How much more improvement will go a long way towards determining if this team can make a playoff run, or miss the playoffs entirely.