New York Rangers Stats: October Scoring Chances Summaries
One month is already in the books for the Rangers, and as I talked about in my summary of the road trip, things have not gone swimmingly. There I covered most of the individual chances, so this time around we'll look at the on ice chances for each player. Per usual, we'll start with the goaltenders, which really just reflects the team totals:
| EVF | EVA | EV +/- | EV Time | EVF/60 | EVA/60 | DIFF | |
| Lundqvist | 74 | 84 | -10 | 376.27 | 11.80 | 13.39 | -1.59 |
| Biron | 21 | 26 | -5 | 106.07 | 11.88 | 14.71 | -2.83 |
| Total | 95 | 110 | -15 | 482.34 | 11.82 | 13.68 | -1.86 |
| PPF | PPA | PP +/- | PP Time | PPF/60 | PPA/60 | DIFF | |
| Lundqvist | 19 | 7 | 12 | 41.23 | 27.65 | 10.19 | 17.46 |
| Biron | 9 | 2 | 7 | 16.35 | 33.03 | 7.34 | 25.69 |
| Total | 28 | 9 | 19 | 57.58 | 29.18 | 9.38 | 19.80 |
| SHF | SHA | SH +/- | SH Time | SHF/60 | SHA/60 | DIFF | |
| Lundqvist | 5 | 34 | -29 | 65.58 | 4.57 | 31.11 | -26.54 |
| Biron | 0 | 3 | -3 | 7.28 | 0.00 | 24.71 | -24.71 |
| Total | 5 | 37 | -32 | 72.87 | 4.12 | 30.47 | -26.35 |
*Data does not reflect the 5v3 situations
Compared to last year at this time, the team's defense has actually improved slightly, but as we've discussed, the offense isn't where it needs to be yet. That leads to fairly miserable 46.3% of the chances in their favor for the month. Ignoring score effects and checking the totals with the score tied makes it worse, with the totals at 45-57 for a 44.1% ratio. While it is a terrible start to the year, the Sharks game did give a look at how the team could perform, as did last night's Ducks game.
After the jump, the data for all the skaters.
| Name | ES CF | ESCA | ES TOI | ES CF/15 | ES CA/15 | PP CF | PPCA | PP TOI | PP CF/15 | PP CA/15 | SH CF | SHCA | SH TOI | SH CF/15 | SH CA/15 |
| RICHARDS | 37 | 39 | 167.73 | 3.31 | 3.49 | 22 | 8 | 39.80 | 8.29 | 3.02 | 0 | 5 | 4.28 | 0.00 | 17.51 |
| GABORIK | 35 | 34 | 158.87 | 3.30 | 3.21 | 20 | 5 | 32.98 | 9.10 | 2.27 | 0 | 1 | 2.70 | 0.00 | 5.56 |
| CALLAHAN | 28 | 40 | 147.27 | 2.85 | 4.07 | 18 | 7 | 36.38 | 7.42 | 2.89 | 2 | 14 | 25.88 | 1.16 | 8.11 |
| DUBINSKY | 27 | 38 | 141.40 | 2.86 | 4.03 | 14 | 4 | 24.42 | 8.60 | 2.46 | 2 | 12 | 24.17 | 1.24 | 7.45 |
| STEPAN | 28 | 31 | 138.53 | 3.03 | 3.36 | 14 | 5 | 25.13 | 8.36 | 2.98 | 1 | 14 | 17.62 | 0.85 | 11.92 |
| FEDOTENKO | 25 | 33 | 130.27 | 2.88 | 3.80 | 2 | 0 | 7.67 | 3.91 | 0.00 | 1 | 11 | 20.65 | 0.73 | 7.99 |
| BOYLE | 22 | 24 | 109.10 | 3.02 | 3.30 | 5 | 2 | 13.48 | 5.56 | 2.22 | 1 | 8 | 19.15 | 0.78 | 6.27 |
| ANISIMOV | 25 | 16 | 107.77 | 3.48 | 2.23 | 1 | 0 | 9.35 | 1.60 | 0.00 | 1 | 5 | 19.90 | 0.75 | 3.77 |
| PRUST | 20 | 26 | 108.75 | 2.76 | 3.59 | 2 | 0 | 2.37 | 12.68 | 0.00 | 1 | 4 | 12.28 | 1.22 | 4.88 |
| WOLSKI | 15 | 12 | 63.02 | 3.57 | 2.86 | 3 | 0 | 6.35 | 7.09 | 0.00 | 0 | 0 | 0.00 | 0.00 | 0.00 |
| CHRISTENSEN | 4 | 13 | 51.65 | 1.16 | 3.78 | 2 | 0 | 6.12 | 4.90 | 0.00 | 0 | 0 | 0.45 | 0.00 | 0.00 |
| RUPP | 3 | 14 | 42.35 | 1.06 | 4.96 | 0 | 0 | 0.87 | 0.00 | 0.00 | 0 | 0 | 0.00 | 0.00 | 0.00 |
| NEWBURY | 3 | 7 | 34.48 | 1.30 | 3.04 | 0 | 0 | 0.40 | 0.00 | 0.00 | 0 | 0 | 0.00 | 0.00 | 0.00 |
| ZUCCARELLO | 1 | 3 | 18.97 | 0.79 | 2.37 | 3 | 3 | 5.58 | 8.06 | 8.06 | 1 | 0 | 0.60 | 25.00 | 0.00 |
| DEVEAUX | 2 | 0 | 6.08 | 4.93 | 0.00 | 0 | 0 | 0.75 | 0.00 | 0.00 | 0 | 0 | 0.00 | 0.00 | 0.00 |
*Table is sortable by clicking the column headers.
The Good: Artem Anisimov (+9), Wojtek Wolski (+3), Andre Deveaux (+2), Marian Gaborik (+1)
Those are your only forwards in the positive, and along with Richards, the top forwards at being on the ice when scoring chances occur. Gaborik is obvious to anyone and Deveaux played 6 minutes, so there's nothing to discuss there. Wolski is much maligned on this team, but he's been good in his role thus far, and the boxscores are slowly catching up. Anisimov has done it so quietly, the coaching staff hasn't even noticed. Artem's also been quite effective on the PK, as the opponents have gotten few chances against him there either. By this measure, he's been our best forward.
The Bad: Ryan Callahan (-12), Brandon Dubinsky (-11), Mike Rupp (-11), Erik Christensen (-9):
The last two names are probably obvious, but the first two definitely seem out of place. As you'll see below with the top pair defense, "Duballahan" has been getting killed by their opposition, which under the Tortorella regime continues to be the hardest the team has to offer. That's best shown by looking at the TOI breakdown, and the chances (per 15 minutes) head to head (click to enlarge):
Head to Head TOI
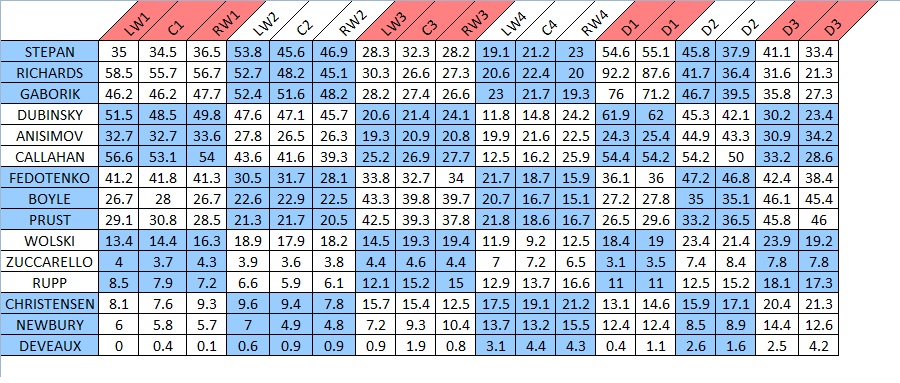
Head to Head SCDIFF/15
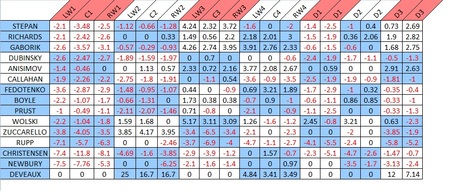
Other than Brad Richards, Dubi and Cally have logged more time against 1st liners than anyone on the roster, with devastating consequence. While that may be excusable, that their performance against 2nd liners was subpar, while all 3 of their centers was better, indicates that the problem may lie with them. Of course, with just 40 minute samples, there's plenty of time for the numbers to look better.
Defending the 1st lines was an issue beyond just Callahan and Dubinsky, as only Anisimov against RW1 was able to at least break even with chances. Even 2nd liners have been a problem, but with solid 2-way forwards like Mike Richards, Frans Nielsen, and Ryan Kesler among the group, they certain did not have an easy group of opponents there either.
You can also see the importance of getting Brad Richards and Marian Gaborik away from the power v power matchups, as he has done quite well against the bottom 6 and bottom 4 people have to offer. That's where the play of the Boyle line comes in. While still negative, they did better against the top lines than the other forwards groups. For success going forward, it will be important that a better job is done to get advantageous matchups.
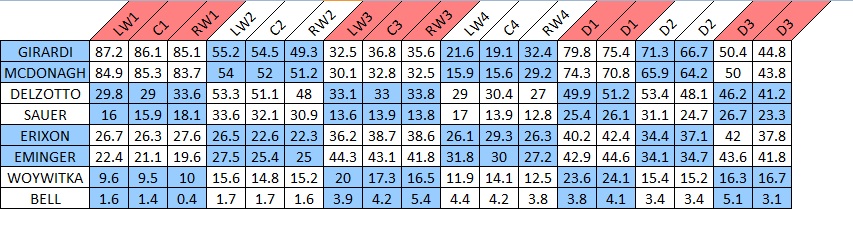
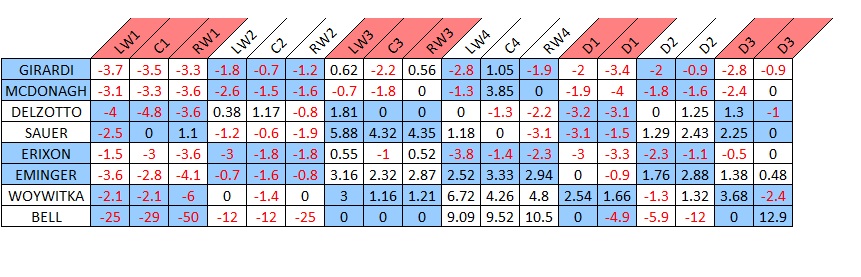
As for the defense:
| Name | ES CF | ESCA | ES TOI | ES CF/20 | ES CA/20 | PP CF | PPCA | PP TOI | PP CF/20 | PP CA/20 | SH CF | SHCA | SH TOI | SH CF/20 | SH CA/20 |
| GIRARDI | 42 | 59 | 211.78 | 3.97 | 5.57 | 10 | 0 | 24.00 | 8.33 | 0.00 | 3 | 25 | 43.00 | 1.40 | 11.63 |
| MCDONAGH | 39 | 54 | 202.57 | 3.85 | 5.33 | 0 | 0 | 4.87 | 0.00 | 0.00 | 4 | 19 | 40.10 | 2.00 | 9.48 |
| DELZOTTO | 25 | 29 | 154.32 | 3.24 | 3.76 | 21 | 7 | 40.70 | 10.32 | 3.44 | 0 | 4 | 12.70 | 0.00 | 6.30 |
| EMINGER | 35 | 27 | 126.13 | 5.55 | 4.28 | 0 | 0 | 0.38 | 0.00 | 0.00 | 1 | 13 | 24.88 | 0.80 | 10.45 |
| ERIXON | 15 | 25 | 120.75 | 2.48 | 4.14 | 1 | 4 | 8.85 | 2.26 | 9.04 | 0 | 1 | 4.97 | 0.00 | 4.03 |
| WOYWITKA | 16 | 12 | 58.08 | 5.51 | 4.13 | 0 | 0 | 0.23 | 0.00 | 0.00 | 0 | 4 | 5.97 | 0.00 | 13.41 |
| SAUER | 15 | 13 | 85.00 | 3.53 | 3.06 | 0 | 0 | 1.20 | 0.00 | 0.00 | 2 | 6 | 14.13 | 2.83 | 8.49 |
| BELL | 3 | 4 | 11.43 | 5.25 | 7.00 | 0 | 0 | 0.00 | 0.00 | 0.00 | 0 | 0 | 0.00 | 0.00 | 0.00 |
*Table is sortable by clicking the column headers.
Head to Head TOI
Head to Head SCDIFF/20
So there you have the sum total of data for October. Annual disclaimer: With 10 games of data, a lot can and will change as the year progresses. If you have any questions regarding what is here, or what may have been overlooked, go ahead and post them in the comments.
Special thanks again to Vic Ferrari of timeonice.com for the ability to produce the data.