Should Henrik Lundqvist Be Considered for the Vezina? (Yes, yes he should).
Another regular season in the books, another year of hockey data finalized. I thought I’d take this time to use some key statistics and evaluate the top goaltenders, conducting our own little analytically-examined version of the traditional Vezina vote amongst General Managers.
We'll pick the three best goalies from each examination graph, giving five points to the best, three points to the 2nd best & one point to 3rd place. At the end, we’ll see how the scoring turns out.
I’ve selected these ten goaltenders to examine:
Braden Holtby
[Note: I did not include Brian Elliot due to his small sample size (41 games, 2261 minutes played). In the 22 years of General Managers voting to determine the Vezina award; the smallest-volume winner (excluding shortened seasons) was Tom Barrasso in 1984 (42 games, 2475 minutes). Thus, Elliot winning the 2016 Vezina would set new historic precedent due to his small sample size, despite his excellent quality.]
Let’s get to it, shall we? Here is the NHL's basic goaltender stats for 2015-16:
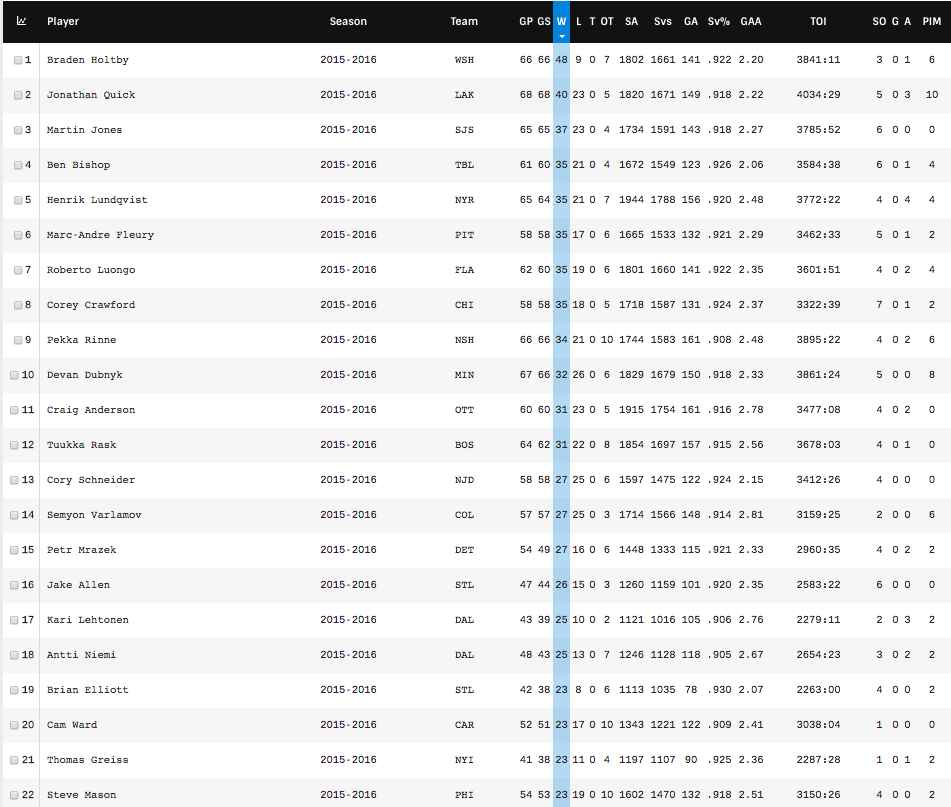
Holtby gets the easy five votes for 1st place, as he tied Martin Brodeur’s wins record of 48. Bishop gets three votes for 2nd place, as he led in GAA (2.06) and behind only Elliot in Save Percentage (.926). And finally we’ll give Marc-Andre Fleury the one-point 3rd place vote, as he’s Top-10 in all three categories of Wins (35), GAA (2.29) and Save Percentage (.921).
Now, with that out of the way, let's begin the analytical examination.
We’ll compare 5v5 data, as it is a better vacuum of all-else-equal when contrasting data. Let’s take a look at the quality of saves each goaltender produced this season (via War-On-Ice):
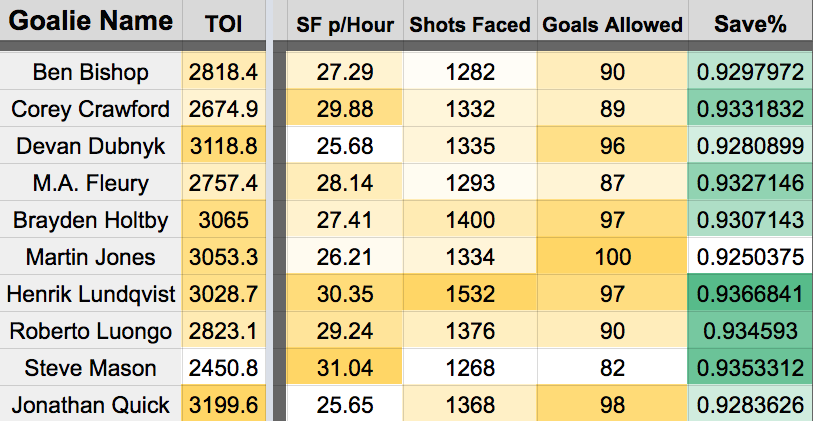
Lundqvist wins five points of having the highest 5v5 Save Percentage despite the heavy volume (most shots faced & runner-up in shots faced per hour). As for the 2nd & 3rd place votes? I think Crawford, Luongo & Mason make great cases, so let’s just divide the remaining four points equally; each receives 1.33 points.
Next we’ll look at each goaltender’s 5v5 performance versus "Low", "Medium" & "High" danger shots against during the season. Before we begin, I should mention Nick Mercadante deserves full credit for formulating this concept. The idea being to compare save percentages in each area of shot difficulty to the NHL average, and yielding a "goals saved above average" from that arithmetic. Here's more elaboration regarding his excellent work with goaltending data on the subject.
We'll start with 5v5 "low-danger" shot quality/quantity (via War-On-Ice):
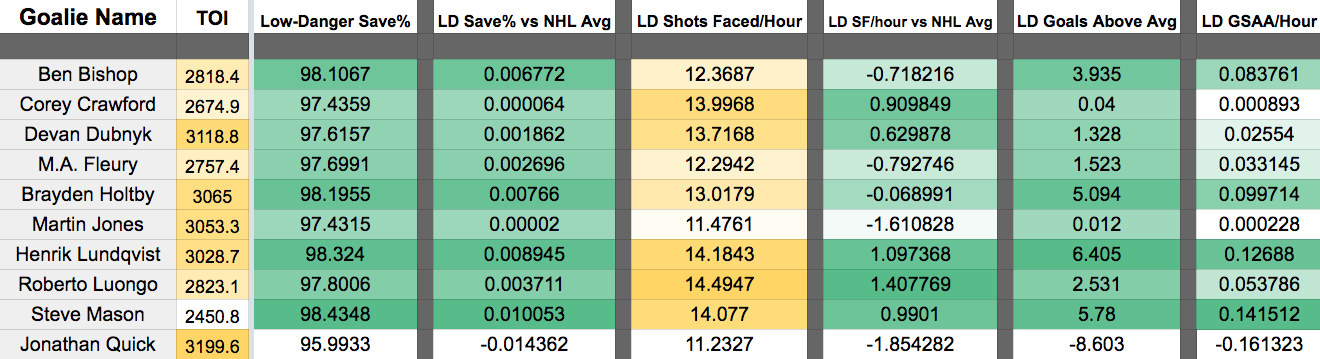
Mason looks the best here, as his quality is clearly superior to the rest of the field, so he gets the five points for 1st place. Lundqvist comes in 2nd, so he gets three points. And we’ll assign the 3rd place point to Holtby, whom has the best remaining LD GSAA/hour.
Next: 5v5 "medium-danger" shot quality/quantity:
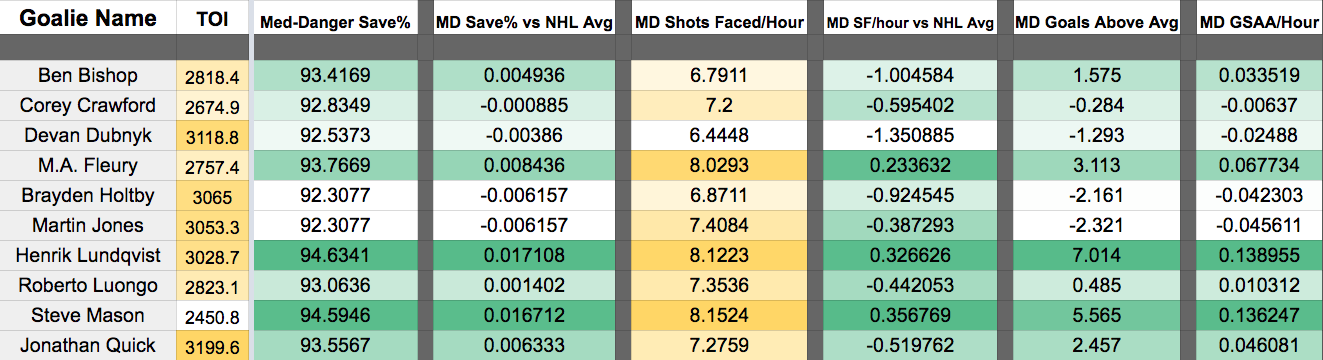
Once again, Lundqvist & Mason stand out with noticeably better quality than the other contenders. This time, we give Lundqvist five points, Mason three points, and Fleury one point.
And finally, 5v5 "high-danger" shot quality/quantity:
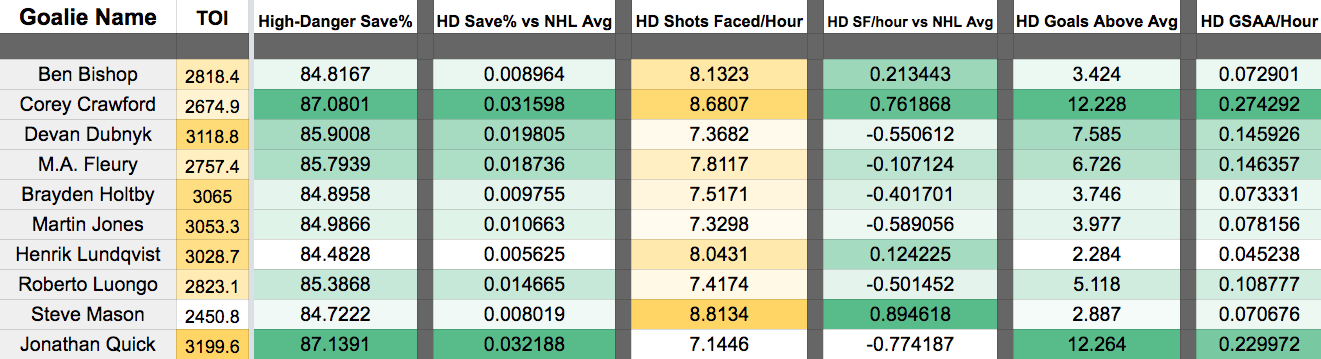
Here, we see a big difference. Lundqvist and Mason actually are now at the bottom of the pack, unlike the previous two graphs. Crawford & Quick boast the best stats against high-danger shot attempts, but we’ll give Crawford the first place points for facing a substantially greater shot frequency. Quick comes in second, and we’ll give Fleury the slight edge over Dubnyk for third place.
Now, there are other conventional means of establishing a goalie’s "Goals Saved Above Average", other than Mercadante’s ingenious shot-quality-vs-average method. Let’s take a look at the Corsica hockey database’s 5v5 statistics, where it incorporates average shot distance itself into "expected" vs "actual" goals allowed.
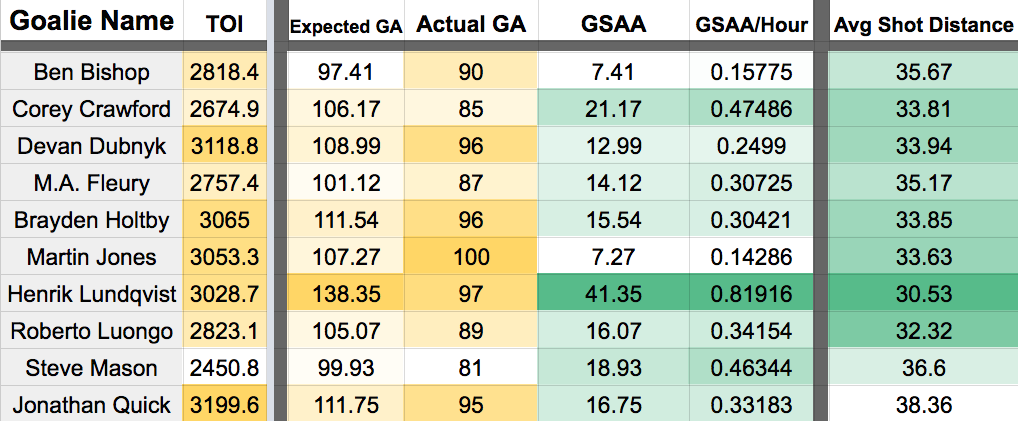
As we can see, Lundqvist’s GSAA and GSAA/hour are major outliers, no doubt directly rooted to the significantly closer distance of the average shot he faces. Lundqvist wins this portion of the analysis, hands down. Crawford and Mason are very close for the 2nd & 3rd place spots, but we'll give the edge to Crawford, as his average shot distance is shorter than Mason’s.
Moving away from 5v5-only data, let’s go to Hockey-Reference’s goaltender metrics of GSAA (Goals Saved Above Average) and GPS (Goalie Point Share). These are metrics, using all ice time strength, to determine a goaltenders relationship to the average goalie (GSAA) and how much he relatively benefits his team (GPS). Let's take a look:
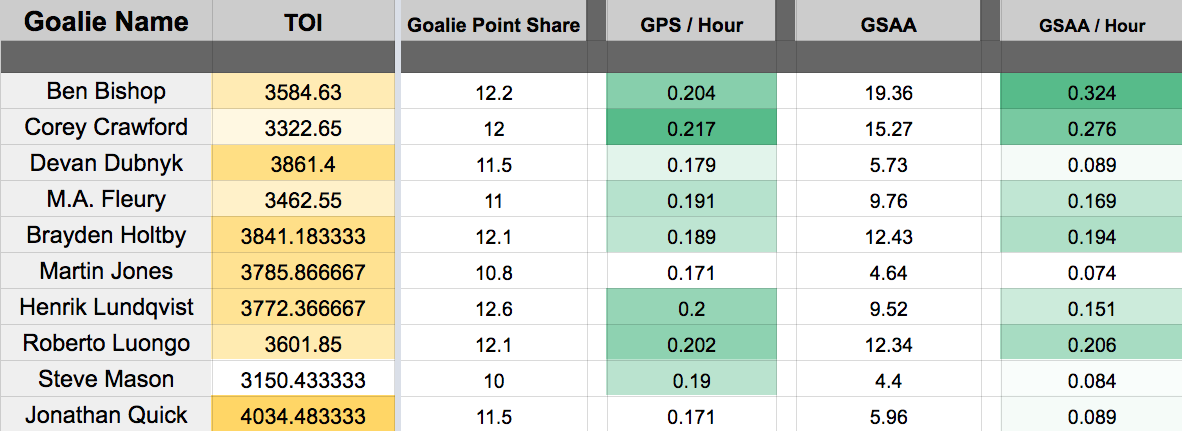
Bishop’s remarkable GSAA/hour earns him 1st place in this contest, with Crawford closely behind in 2nd. Luongo (not far ahead of Fleury, Holtby and Lundqvist) wins 3rd place.
And finally, let's take a look at "clutch" save percentage; that being taking into account data when a goaltender's team is tied, or in a closely-scored game. (Data via War-On-Ice):
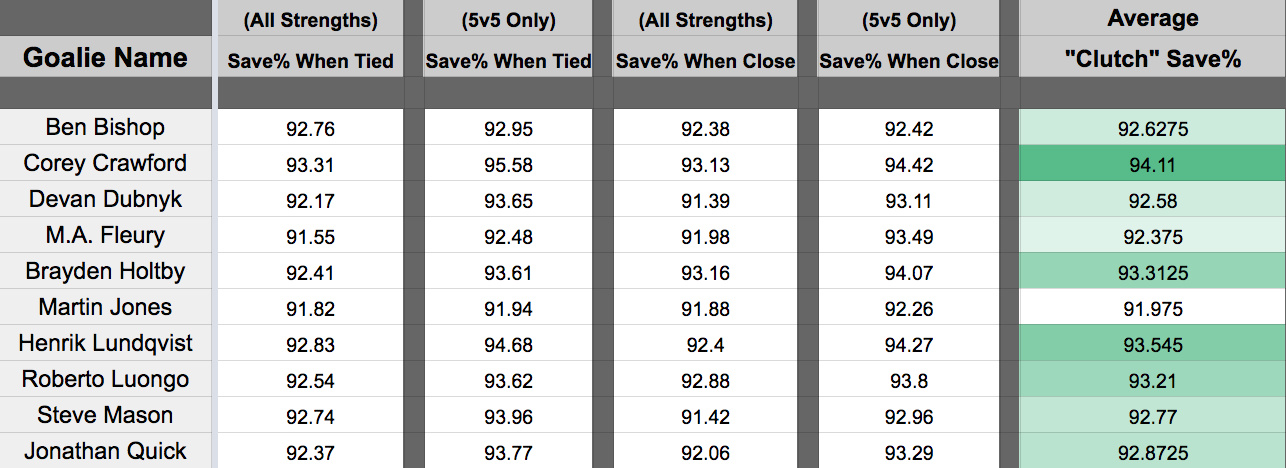
Crawford easily wins this category, being the only one of the bunch to to have an average "clutch" above 94%. Second place goes to Lundqvist, and third place to Holtby.
Final Count
1st Place: Lundqvist (21 points)
2nd Place: Crawford (17.3 points)
3rd Place: Mason (10.3 points)
4th Place: Bishop (8 points)
5th Place: Holtby (7 points)
6th Place: Fleury/Quick (3 points)
Conclusion
So while Crawford or Lundqvist's face-value stats don't seem terribly impressive, given the scopes we've explored, it seems either would be very deserved of winning the Vezina. This exercise should serve as an invariable reminder that a goaltender's stats are always relative; an average goalie on an above-average team can certainly seem better than an above-average goalie on an average team. But thanks to the wonderful community of hockey analytics, we can roll up our sleeves and experiment with the truth revealed in perspective statistics.