Why The Rangers Won't Be the Next Wild
Shooting trends for this team have become quite the heated topic lately. Previous posts from Rob L. have painted the picture of a team playing above it's skill level. My last post on the topic showed a team still a bit too reliant on its goaltending. Even some of the advanced stat guys are starting to make some noise about the Rangers, like Rob Vollman did with this tweet several days ago:
Now that Minnesota has plunged as us fancy-stats guys predicted maybe you'll pay attention to this: the NY Rangers are next.
If you're wondering about those past predictions, you can find stories here, and here, among other places. Like the '09 Avalanche, and '10 Stars before them, the '11 Wild are a poor possession team riding hot goaltending to a fast start, and then the bottom fell out. Not suprisingly, those fans all brought up similar counter arguments before the collapses. 'We have a system." "You can't measure a team's heart." "We limit shot quality." "Stats don't capture everything." If you've been reading the comments here lately, you've seen similar counter arguments. So why are we different? We're a better team, and I'm going to show you why.
The standard go to arguments against sustained success point to two things, Fenwick with the score Tied, and PDO. For refreshers on both: Fenwick is simply the ratio of even strength shots directed at the net for a team compared to its opponents. PDO is the total of even strength save percentage and even strength shooting percentage. For this article, in both cases, I will be using the stats under 'close' conditions. That is defined as any 1-goal game state during the first two periods, and tied game states in the 3rd. While this actually paints a darker picture for the Rangers compared to Fenwick tied, it helps expand the sample size, which is important when looking at only a half-season's worth of data.
After the jump, a comparison of all 4 teams.
Before we get 'advanced', let's look at the basic:
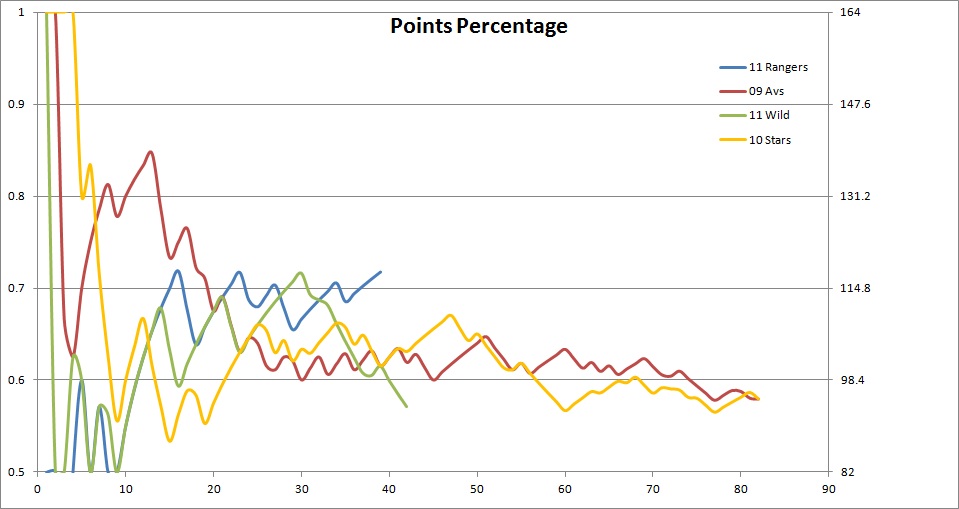
By this point of the season, the Rangers already show some separation from the previous three teams, who were all at 48 points (61.5%) at this stage. Still, just 10 games ago the Wild were on a similar place before their swan dive, so their current standing is not something that can be relied on too heavily. It's been shown by Rob Vollman that points isn't as good a predictor as goals or shots, so let's look at those.
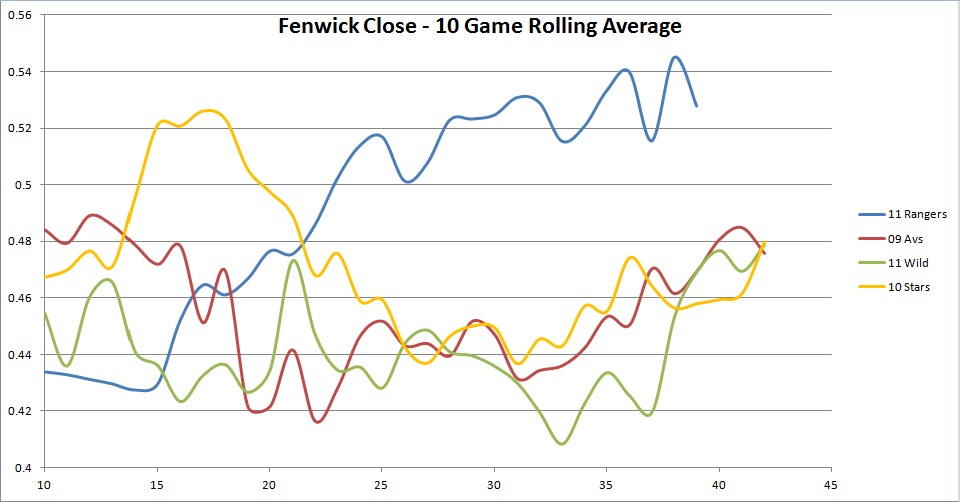
As the title implies, this is a rolling 10 game average of close game Fenwick, so the 10 on the x-axis is for games 1-10, 15 for 6-15, and so on. The data comes from timeonice.com, and thus includes all even strength situations, including 4v4. It mostly looks a mash up of lines, but you can see clear separation starting at game 25 or so. Coinciding roughly with the call up of possession dynamo Carl Hagelin, the Rangers have been consistently above 50% for some time now, reaching as high as 54%. That is something that none of the previous "regressionist specials" can claim, aside from an early season stretch for the Stars. Over the course of a full season, the 54% the Rangers recently hit would put them right with the elite possession teams in the league, like the Red Wings and Bruins. That link shows us full season data, so let's look at that as well:

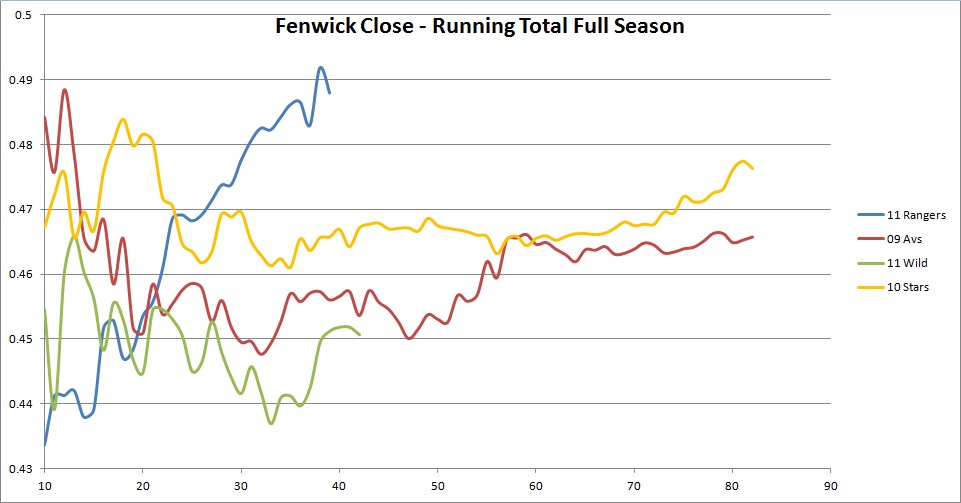
Once again, there's clear separation from the previous teams and this one. For the first 10 games, the Rangers were the poorest team by a good margin, playing at a rate that would've been the second worst in the last five seasons. Since that time, the team has steadily climbed to 49%, which would still them in the bottom third of the league, but markedly improved from the 43% they came back from Europe with. (The link above has the Rangers at 48%, because Behind the Net's data is strictly 5v5). 48-49% still shouldn't be good enough to have one of the best 5v5 goal ratios in the league, but that's where PDO comes in.
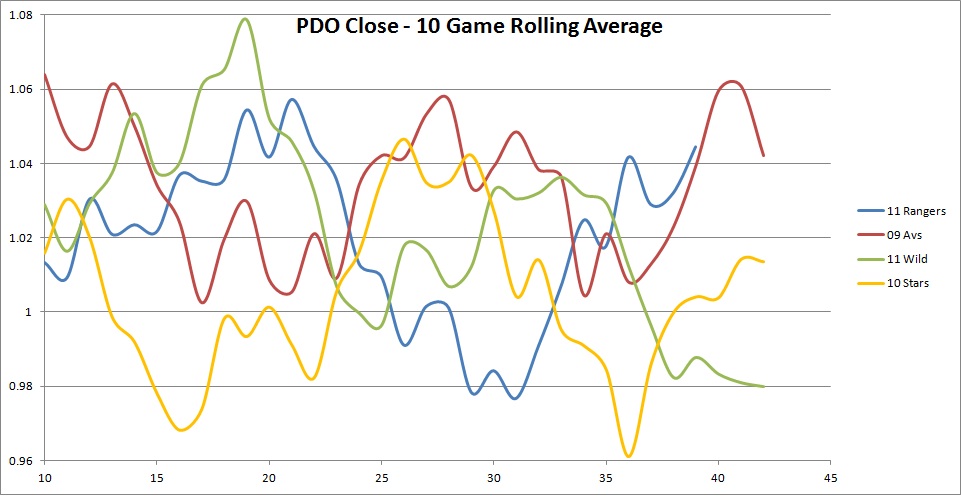
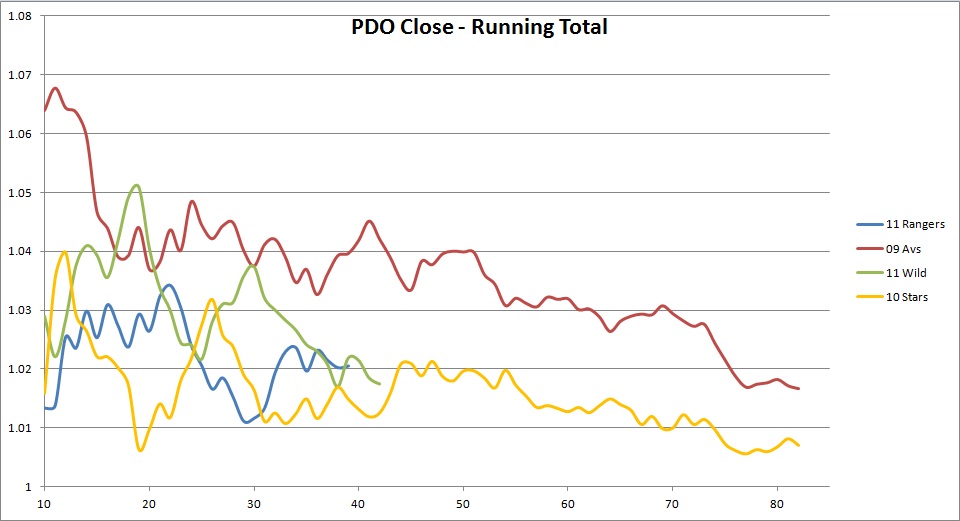
Same as above, this is a 10 game rolling average of PDO in close situations. This chart is really more for continuity with the Fenwick charts than to draw conclusions. A 10 game sample is too small to gain anything meaningful, as the puck bounces funny for everyone. Instead, let's look at the cumulative results:
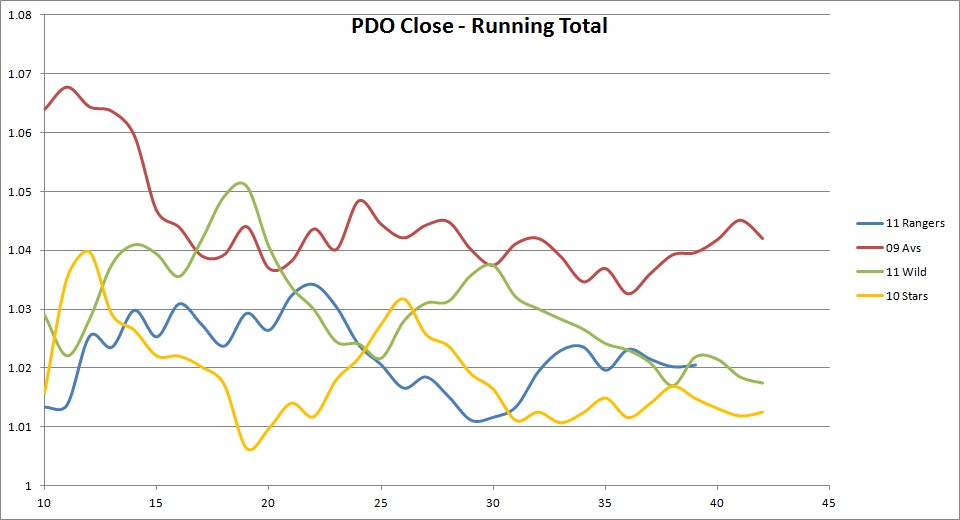
This looks a lot less jumbled, and also reasonably favorable for the Rangers. The Avalanche were on another planet when it came to running well, so they're not really a true comparable. The other teams were at similar points at this stage of the season, posting a PDO of about 102. That number is no worse than Detroit (103.6), SJ (102.2) or Boston (102.0) has posted in similar situations, but because their possession numbers are good, no one worries about their PDO dropping. Like the Stars before them, the Rangers already hit one lull, but they survived it because they already started controlling play the way a top team should.
Of course, this isn't about what has happened as much as what will happen, so let's look at the cumulative charts again, this time with the Avalanche and Stars full season data:
The two teams prior actually improved their possession down the stretch, but could not outrun the inevitability that is PDO. Thus while they didn't lose any momentum, they could not improve a points pace that ultimately either barely squeaked them in the playoffs (Avs) or resulted in a lost season (Stars)
Summing it up, there's little reason to think that this Rangers team will end up the 95 point teams that the Avalanche and Stars became, and Wild are on pace to join. However, that does not mean this will end up being the 115 point team they are on pace to be either. In that regard, the Rangers are likely due to come back to earth a little bit as their PDO stabilizes. There will be a downturn this season, whether it comes from their Fenwick taking a hit again, shots not finding the back of the net any more, or just that Henrik Lundqvist and especially Martin Biron start to have a few bounces go against them. Still, as long as things stay as they've been in the "Hagelin Era" of New York Rangers hockey, there's no reason this team can't stay among the leaders of the East. After all, in what is really the handbook for advanced stats, VUKOTA predicted the Rangers to be the 4th best team in the NHL. Who are we to argue? (Even if they had Buffalo ahead of us).