Rangers Analysis: Individual Scoring Chances
I covered the Rangers' even strength shooting back in the pre-Brad Richards era, but most fans will tell you not all shots are created equal. That's why I took on the project of tracking scoring chances for the team this year. By monitoring and recording the shots that come from the dangerous scoring areas, it will help give us some more insight into the team's offense. For those that don't remember or have simply blocked it out of memory, here's the standard definition being used by the group of trackers:
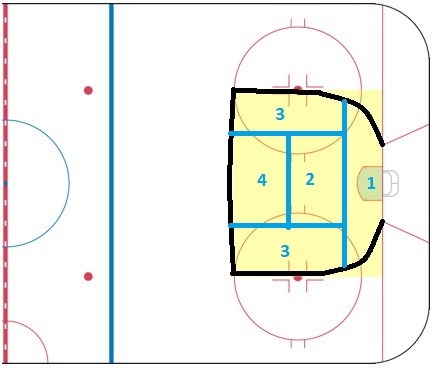
A scoring chance is defined as a clear play directed toward the opposing net from a dangerous scoring area - loosely defined as the top of the circle in and inside the faceoff dots, though sometimes slightly more generous than that depending on the amount of immediately-preceding puck movement or screens in front of the net. Blocked shots are generally not included, but missed shots are. A player is awarded a scoring chance anytime he is on the ice and someone from either team has a chance to score. He is awarded a "chance for" if someone on his team has a chance to score and a "chance against" if the opposing team has a chance to score.
The project is made possible courtesy of Vic Ferrari, who gave us the script that keeps this project relatively simple. You can also find a very crude map of the area here, which included a breakdown of scoring areas I did not use during the regular season.
After the jump, we'll look at the data for this past season, and discuss what to look for in the upcoming season.
The first table we'll look at is the number of individual chances by the forwards, and their individual conversion rates. This data is for 5v5 situations only, and includes shots that missed the net. The table is sortable by clicking the column headers.
| Name | SCF | Goals | SCSH% | SCF/60 |
| Anisimov | 112 | 14 | 12.500% | 6.343 |
| Boyle | 103 | 13 | 12.621% | 5.815 |
| Gaborik | 99 | 13 | 13.131% | 6.853 |
| Stepan | 89 | 15 | 16.854% | 4.956 |
| Dubinsky | 86 | 15 | 17.442% | 4.612 |
| Callahan | 67 | 9 | 13.433% | 4.873 |
| Avery | 62 | 3 | 4.839% | 4.520 |
| Fedotenko | 60 | 6 | 10.000% | 4.261 |
| Prust | 51 | 8 | 15.686% | 3.160 |
| Frolov | 43 | 5 | 11.628% | 4.996 |
| Christensen | 38 | 5 | 13.158% | 3.527 |
| Zuccarello | 37 | 4 | 10.811% | 4.673 |
| Wolski | 31 | 4 | 12.903% | N/A |
| Prospal | 28 | 6 | 21.429% | 4.792 |
| Drury | 15 | 1 | 6.667% | 3.910 |
| Kolarik | 5 | 0 | 0.000% | 8.950 |
| Newbury | 5 | 0 | 0.000% | 3.726 |
| Boogaard | 4 | 1 | 25.000% | 2.408 |
| Weise | 4 | 0 | 0.000% | 3.756 |
| White | 4 | 1 | 25.000% | 1.916 |
| Grachev | 2 | 0 | 0.000% | 1.976 |
| Total | 945 | 123 | 13.016% |
It's interesting to see that despite varying levels of perceived skill, there's not a great deal of separation in each players ability to convert their chances. Most players are within 1% of the team average. Those that were above that had what can be considered breakout seasons (Derek Stepan, Brandon Prust), while those below struggled compared to their typical goal scoring levels (Chris Drury, Sean Avery).
I also included the SCF/60, which is the amount of chances per 60 minutes of ice time, as a way of adjusting for a player like Vinny Prospal, who only played a part of the season. One quick note, you'll see that I don't have a SCF/60 for Wojtek Wolski. This is because I don't have an ice time breakdown for his time with the Phoenix Coyotes versus his time with the Rangers. The players that had many shots at even strength, Brian Boyle and Marian Gaborik, of course are around the top of this list as well. As for the defense:
| Name | SCF | Goals | SCSH% | SCF/60 |
| Gilroy | 19 | 2 | 10.526% | 1.598 |
| Staal | 18 | 1 | 5.556% | 0.732 |
| Sauer | 13 | 1 | 7.692% | 0.670 |
| Del Zotto | 12 | 0 | 0.000% | 1.044 |
| Girardi | 11 | 2 | 18.182% | 0.445 |
| Eminger | 7 | 1 | 14.286% | 0.468 |
| McDonagh | 6 | 1 | 16.667% | 0.551 |
| McCabe | 3 | 0 | 0.000% | NA |
| Total | 89 | 8 | 8.989% |
It shouldn't be much of a surprise that the data here is not very plentiful. A typical defensemen doesn't generally find themselves in the slot area or down around the net, especially at even strength. The value here I feel is in looking at the time adjusted total. That shows the two most offensively inclined defensemen, Michael Del Zotto and Matt Gilroy, are the ones that generated the most chances for themselves. On the other end of the scale, it's interesting to note that while Girardi led the team D in points, he trailed the pack in chances.
The final table here is a look at the comparison between the chances and the total shots at even strength, again with the reminder that this includes all missed nets. This data courtesy of behindthenet.ca.
| Name | SCG | SCF | ESG | Shots | SC% |
| Kolarik | 0 | 5 | 0 | 6 | 83.33% |
| Anisimov | 14 | 112 | 14 | 205 | 54.63% |
| Prospal | 6 | 28 | 7 | 52 | 53.85% |
| Gaborik | 13 | 99 | 15 | 187 | 52.94% |
| Frolov | 5 | 43 | 6 | 83 | 51.81% |
| Boogaard | 1 | 4 | 1 | 8 | 50.00% |
| Grachev | 0 | 2 | 0 | 4 | 50.00% |
| Newbury | 0 | 5 | 0 | 10 | 50.00% |
| Prust | 8 | 51 | 9 | 102 | 50.00% |
| Stepan | 15 | 89 | 17 | 187 | 47.59% |
| Forwards | 119 | 914 | 136 | 2029 | 45.05% |
| Christensen | 5 | 38 | 7 | 85 | 44.71% |
| Zuccarello | 4 | 37 | 4 | 83 | 44.58% |
| Dubinsky | 15 | 86 | 17 | 204 | 42.16% |
| Callahan | 9 | 67 | 10 | 164 | 40.85% |
| Drury | 1 | 15 | 1 | 37 | 40.54% |
| Boyle | 13 | 103 | 16 | 256 | 40.23% |
| Fedotenko | 6 | 60 | 8 | 150 | 40.00% |
| Weise | 0 | 4 | 0 | 11 | 36.36% |
| Avery | 3 | 62 | 3 | 182 | 34.07% |
| White | 1 | 4 | 1 | 12 | 33.33% |
| Gilroy | 2 | 19 | 3 | 75 | 25.33% |
| Defense | 8 | 86 | 10 | 415 | 20.72% |
| Del Zotto | 0 | 12 | 0 | 61 | 19.67% |
| Eminger | 1 | 7 | 2 | 37 | 18.92% |
| McDonagh | 1 | 6 | 1 | 37 | 16.22% |
| Sauer | 1 | 13 | 2 | 81 | 16.05% |
| Staal | 1 | 18 | 1 | 118 | 15.25% |
| Girardi | 2 | 11 | 2 | 98 | 11.22% |
| Williams | 0 | 0 | 0 | 0 | 0.00% |
| Dupont | 0 | 0 | 0 | 1 | 0.00% |
| Wolski | 4 | 31 | |||
| McCabe | 0 | 3 |
Again, split team data is not readily available, so Wolski and Bryan McCabe are not included.
There are a couple of notable things in this table. First, Sean Avery really hated being close to the net this year, as he was well below the other regular forwards on the team in the amount of shots he got from the scoring chance area. Although he also converted a poor percentage, this more than anything was a reason that he struggled in the goal column this season. We also see that the more skilled forwards on the team, Gaborik, Prospal, and Artem Anisimov, were able to get their shots at a proportionally better rate than the 'grinders' on the team.
With nothing to compare this data to, it's hard to make any definitive conclusions on the numbers here. So in reality, this is mostly for informational purposes. If anyone has ideas on how to improve the data, or general ideas on what to conclude from the data we do have, go ahead and include them in the comments.

