What Are They Worth - Ryan Callahan
This is the week of reckoning for the contract of Brandon Dubinsky, with his arbitration hearing scheduled for this Thursday, July 21st. There is an equally important arbitration hearing for the Rangers the following week, as Ryan Callahan's hearing comes the following Thursday. I already looked at the expected value of Brandon Dubinsky, and determined that a reasonable deal for him would be $4.28m for 4 years. Using similar methods, we'll determine what can be expected as Callahan moves through the prime of his career.
Just like last time, I ran a search on hockey-reference.com, searching for the combined seasons of all players who played at least 200 games, post lockout. This time the age range is from 23 to 25, representing Ryan's last three seasons. The list of 74 players is once again headed by Alex Ovechkin (304 points), down through Darrell Powe of Philadelphia. Then I narrowed the list to all those within 0.1 points of Callahan's point per game mark over that stretch (0.57).
The list of those players is after the jump.
| Player | From | To | Tm | GP | G | A | PTS | GC | P/M | PIM | EV | PP | SH | S | S% | TOI | PPG |
| Jarret Stoll | 2006 | 2008 | EDM | 214 | 49 | 94 | 143 | 51 | -17 | 196 | 19 | 25 | 5 | 545 | 9.0 | 3888 | 0.67 |
| Stephen Weiss | 2007 | 2009 | FLA | 226 | 47 | 104 | 151 | 54 | 32 | 90 | 28 | 18 | 1 | 462 | 10.2 | 3957 | 0.67 |
| Milan Michalek | 2008 | 2010 | TOT | 222 | 69 | 77 | 146 | 57 | 18 | 117 | 47 | 19 | 3 | 575 | 12.0 | 4054 | 0.66 |
| Joe Pavelski | 2008 | 2010 | SJS | 229 | 69 | 81 | 150 | 58 | 7 | 100 | 45 | 19 | 5 | 701 | 9.8 | 3979 | 0.66 |
| Tomas Plekanec | 2006 | 2008 | MTL | 229 | 58 | 87 | 145 | 55 | 29 | 110 | 36 | 18 | 4 | 435 | 13.3 | 3647 | 0.63 |
| Drew Stafford | 2009 | 2011 | BUF | 212 | 65 | 66 | 131 | 52 | 20 | 98 | 40 | 25 | 0 | 543 | 12.0 | 3288 | 0.62 |
| Andrew Ladd | 2009 | 2011 | TOT | 245 | 61 | 85 | 146 | 56 | 18 | 134 | 50 | 9 | 2 | 538 | 11.3 | 3929 | 0.60 |
| Scott Hartnell | 2006 | 2008 | TOT | 225 | 71 | 59 | 130 | 54 | 29 | 356 | 38 | 30 | 3 | 537 | 13.2 | 3604 | 0.58 |
| David Backes | 2008 | 2010 | STL | 233 | 61 | 72 | 133 | 52 | -18 | 370 | 45 | 14 | 2 | 500 | 12.2 | 3953 | 0.57 |
| Ryan Callahan | 2009 | 2011 | NYR | 218 | 64 | 61 | 125 | 51 | -12 | 139 | 42 | 21 | 1 | 620 | 10.3 | 4070 | 0.57 |
| Chris Higgins | 2007 | 2009 | MTL | 200 | 61 | 52 | 113 | 47 | -12 | 70 | 34 | 22 | 5 | 551 | 11.1 | 3533 | 0.57 |
| Joffrey Lupul | 2007 | 2009 | TOT | 216 | 61 | 63 | 124 | 51 | -26 | 138 | 43 | 18 | 0 | 542 | 11.3 | 3522 | 0.57 |
| Lee Stempniak | 2007 | 2009 | TOT | 237 | 54 | 80 | 134 | 50 | -14 | 106 | 40 | 14 | 0 | 499 | 10.8 | 3718 | 0.57 |
| Andrei Kostitsyn | 2009 | 2011 | MTL | 214 | 58 | 61 | 119 | 48 | -3 | 118 | 41 | 17 | 0 | 501 | 11.6 | 3384 | 0.56 |
| Clarke MacArthur | 2009 | 2011 | TOT | 234 | 54 | 74 | 128 | 49 | -23 | 142 | 38 | 15 | 1 | 391 | 13.8 | 3576 | 0.55 |
| Tuomo Ruutu | 2007 | 2009 | TOT | 227 | 53 | 71 | 124 | 48 | 8 | 265 | 38 | 15 | 0 | 405 | 13.1 | 3902 | 0.55 |
| Tomas Fleischmann | 2008 | 2010 | WSH | 217 | 52 | 66 | 118 | 46 | -1 | 66 | 37 | 15 | 0 | 359 | 14.5 | 3154 | 0.54 |
| Matt Stajan | 2007 | 2009 | TOR | 240 | 41 | 86 | 127 | 45 | -12 | 145 | 30 | 8 | 3 | 373 | 11.0 | 4161 | 0.53 |
| Valtteri Filppula | 2008 | 2010 | DET | 213 | 42 | 69 | 111 | 41 | 21 | 94 | 36 | 5 | 1 | 365 | 11.5 | 3614 | 0.52 |
| Jiri Hudler | 2007 | 2009 | DET | 239 | 51 | 73 | 124 | 47 | 34 | 78 | 39 | 12 | 0 | 393 | 13.0 | 2949 | 0.52 |
| Jussi Jokinen | 2007 | 2009 | TOT | 225 | 37 | 80 | 117 | 41 | -16 | 64 | 23 | 14 | 0 | 353 | 10.5 | 3268 | 0.52 |
| Alex Steen | 2008 | 2010 | TOT | 225 | 47 | 70 | 117 | 44 | -4 | 92 | 31 | 12 | 4 | 506 | 9.3 | 3805 | 0.52 |
| Antoine Vermette | 2006 | 2008 | OTT | 240 | 64 | 61 | 125 | 51 | 18 | 147 | 45 | 7 | 12 | 449 | 14.3 | 3665 | 0.52 |
| Mason Raymond | 2009 | 2011 | VAN | 224 | 51 | 64 | 115 | 44 | 10 | 82 | 36 | 14 | 1 | 559 | 9.1 | 3514 | 0.51 |
| R.J. Umberger | 2006 | 2008 | PHI | 228 | 49 | 67 | 116 | 45 | -23 | 78 | 36 | 11 | 2 | 445 | 11.0 | 3465 | 0.51 |
| Matthew Lombardi | 2006 | 2008 | CGY | 218 | 40 | 68 | 108 | 40 | 3 | 163 | 24 | 8 | 8 | 429 | 9.3 | 3523 | 0.50 |
| Petr Prucha | 2006 | 2008 | NYR | 209 | 59 | 45 | 104 | 43 | -1 | 84 | 33 | 26 | 0 | 355 | 16.6 | 2679 | 0.50 |
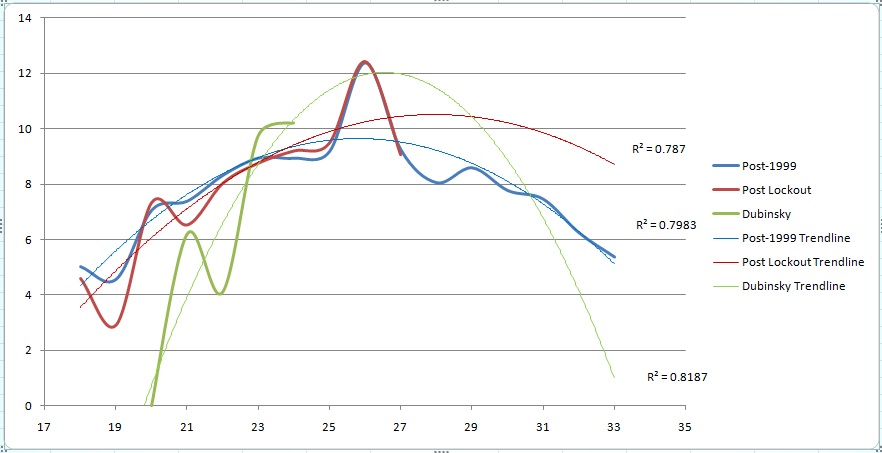
Since Dubinsky and Callahan are so often compared to each other, it makes sense that there's considerable overlap in comparable players, with names like Joe Pavelski, David Backes, and Drew Stafford appearing on both players' lists. Where they don't overlap, there are a number of solid 2nd line scoring options, such as Tuomo Ruutu, Scott Hartnell, and Mason Raymond. Plotting this group's Goals Versus Threshold yields the following graph (click to enlarge):
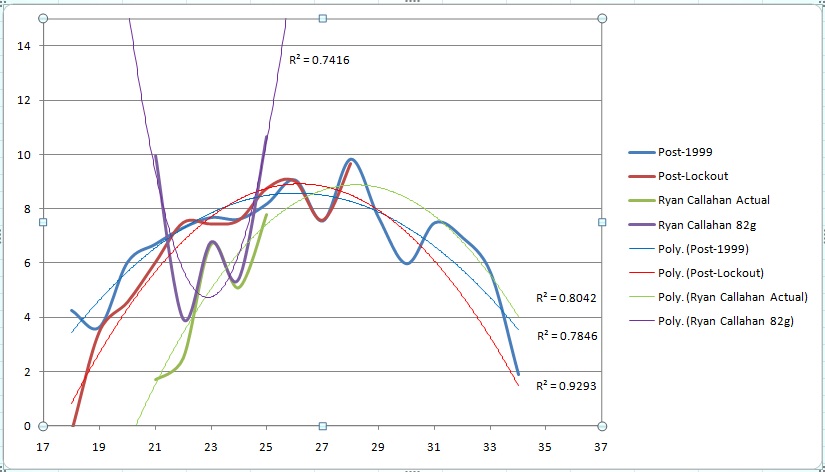
This graph looks a bit different than Dubinsky's, so let me explain why. In the Brad Richards and Brandon Dubinsky plots, I used the 82 game equivalents of their year to year GVT. That line is shown in purple here, and clearly would not work for the purposes of this study (well unless you think Callahan will retire the greatest player ever.). So to get a better projection, I instead used Callahan's actual GVT from season to season, shown in green. This gave a plot that more closely resembles his peer group (in red). The final line is an expansion of the peer group, including all players post 1999, which serves to give a glimpse of how they actually perform after age 30.
Going back to the Dubinsky chart, we saw a group that peaked at age 26 with about 12 GVT. This group shows a peak at 28 of around 10 GVT, although the trendlines show the peak should be closer to the 26/27 age. This past year, Callahan surpassed the play of this group, but injuries kept his numbers down to fit right alongside the group.
Assigning a dollar value to the data, the trend line says that Callahan will have a GVT of 34.39 over the next 4 years. Using the same $367k per GVT rate we used for Dubinsky, that means that the 4 year contract for Callahan would be $12.62m, or a cap hit of $3.155m. That's more than $1m less than Dubinsky, which seems out of line with public perception. This is where the note below the graph comes in. The comparison right now is not completely apples to apples.
Dubinsky's $4.28m was based on the assumption that he will play 82 games every year, while Callahan's is based on his current rate of games played, which has not been close to 82. We can adjust for that two ways. First, we could compare Dubinsky's actual GVT year to year, which gives an estimate of $15.03m, or a cap hit of $3.75m. The alternative is to use Callahan's last season 82 game GVT (10.6), and repeat it. That would also give a cap hit of $3.75m.
The end result in both cases says Dubinsky would be worth about $600k more than Callahan. Given the current market, I'm more inclined to go with the higher values, where Dubinsky stays at $4.28m, and Callahan comes in at $3.75m, for a combined total of around $8.03m, perfect for the Rangers team.
Voice your disagreements with Callahan's expected value below.
