What Are They Worth - Brandon Dubinsky
We're just one week away now from the first of the three arbitration hearings scheduled for the New York Rangers, that of Brandon Dubinsky. Last year at this time, I looked at the progression of Dubinsky's career, and came to the conclusion that with some more shots on goal and more consistency, he could develop into a solid first liner. He certainly showed both of those qualities this year, but the question still exists among the fan base on whether he can reach that next level. To get a clearer picture, I decided to take a look at some comparable players, and see if we can estimate his value going forward.
To start off, I ran a search through hockey-reference.com, searching for the combined seasons of all players who played at least 200 games, between ages 22 and 24, post-lockout. That list produces 59 players, ranging in points from Alex Ovechkin (331) to Ryan Hollweg (12). From that list, I narrowed it down to all of those within 0.1 of Dubinsky's point per game average (0.61). That list gives 22 players.
The details of these players can be found after the jump.
| Name | Year | Year | Team | GP | G | A | P | p/m | EV | PP | SH | S | S% | TOI | PPG |
| Loui Eriksson | 2008 | 2010 | DAL | 233 | 79 | 86 | 165 | 15 | 59 | 17 | 3 | 512 | 15.4 | 4214 | 0.71 |
| Pierre-Marc Bouchard | 2007 | 2009 | MIN | 234 | 49 | 117 | 166 | 19 | 36 | 13 | 0 | 444 | 11 | 3881 | 0.71 |
| Dustin Brown | 2007 | 2009 | LAK | 239 | 74 | 85 | 159 | -49 | 40 | 32 | 2 | 706 | 10.5 | 4651 | 0.67 |
| Travis Zajac | 2008 | 2010 | NJD | 246 | 59 | 104 | 163 | 44 | 42 | 16 | 1 | 550 | 10.7 | 4559 | 0.66 |
| Devin Setoguchi | 2009 | 2011 | SJS | 223 | 73 | 69 | 142 | 14 | 50 | 23 | 0 | 610 | 12 | 3479 | 0.64 |
| Nikolai Zherdev | 2007 | 2009 | TOT | 235 | 59 | 92 | 151 | -22 | 44 | 14 | 1 | 637 | 9.3 | 4120 | 0.64 |
| Jussi Jokinen | 2006 | 2008 | TOT | 235 | 47 | 98 | 145 | -4 | 27 | 20 | 0 | 359 | 13.1 | 3280 | 0.62 |
| Joe Pavelski | 2007 | 2009 | SJS | 208 | 58 | 69 | 127 | 10 | 33 | 21 | 4 | 584 | 9.9 | 3365 | 0.61 |
| Brandon Dubinsky | 2009 | 2011 | NYR | 228 | 57 | 82 | 139 | 0 | 39 | 13 | 5 | 555 | 10.3 | 4271 | 0.61 |
| Wojtek Wolski | 2009 | 2011 | TOT | 231 | 49 | 93 | 142 | 14 | 43 | 5 | 1 | 499 | 9.8 | 3998 | 0.61 |
| Andrei Kostitsyn | 2008 | 2010 | MTL | 211 | 64 | 63 | 127 | 9 | 40 | 24 | 0 | 461 | 13.9 | 3321 | 0.6 |
| Kris Versteeg | 2009 | 2011 | TOT | 237 | 63 | 80 | 143 | 14 | 39 | 16 | 8 | 503 | 12.5 | 3990 | 0.6 |
| Mikko Koivu | 2006 | 2008 | MIN | 203 | 37 | 80 | 117 | 10 | 21 | 14 | 2 | 402 | 9.2 | 3474 | 0.58 |
| Joffrey Lupul | 2006 | 2008 | TOT | 218 | 64 | 63 | 127 | -40 | 38 | 24 | 2 | 644 | 9.9 | 3630 | 0.58 |
| Chris Higgins | 2006 | 2008 | MTL | 223 | 72 | 56 | 128 | -12 | 39 | 27 | 6 | 548 | 13.1 | 3717 | 0.57 |
| Drew Stafford | 2008 | 2010 | BUF | 214 | 50 | 67 | 117 | 10 | 35 | 15 | 0 | 467 | 10.7 | 3128 | 0.55 |
| Patrick O'Sullivan | 2008 | 2010 | TOT | 236 | 49 | 81 | 130 | -49 | 36 | 8 | 5 | 670 | 7.3 | 4364 | 0.55 |
| David Backes | 2007 | 2009 | STL | 203 | 54 | 54 | 108 | -8 | 41 | 11 | 2 | 426 | 12.7 | 3165 | 0.53 |
| Ryan Kesler | 2007 | 2009 | VAN | 210 | 53 | 59 | 112 | 10 | 35 | 14 | 4 | 444 | 11.9 | 3908 | 0.53 |
| Lee Stempniak | 2006 | 2008 | STL | 219 | 54 | 63 | 117 | -12 | 38 | 16 | 0 | 428 | 12.6 | 3296 | 0.53 |
| Nikolai Kulemin | 2009 | 2011 | TOR | 233 | 61 | 63 | 124 | -1 | 52 | 7 | 2 | 447 | 13.6 | 3705 | 0.53 |
| Andrew Ladd | 2008 | 2010 | TOT | 227 | 46 | 71 | 117 | 41 | 45 | 1 | 0 | 474 | 9.7 | 3108 | 0.52 |
| Blake Wheeler | 2009 | 2011 | TOT | 244 | 57 | 70 | 127 | 42 | 48 | 6 | 3 | 488 | 11.7 | 3720 | 0.52 |
The list has a very eclectic group of players. Some are bonafide first liners, like Mikko Koivu and Loui Eriksson. Some are second in command to Hall of Fame level centers, like Joe Pavelski and Ryan Kesler. Others, like ex-Rangers Nikolai Zherdev and Christopher Higgins, have been reduced to 3rd line role players.
From here, I could just grab the average salaries of these players and call it a day, but the truth is that very few on this list signed deals after their 24 year old season (just 6), and even fewer signed multi-year deals (only Loui Eriksson and Chris Higgins). That leaves us with a very uneven comparison of how Dubinsky's contract should be treated. Instead, I'm going to use the same tool I used in my Brad Richards article. That tool was GVT, or Goals versus Threshold. As a reminder, GVT is a statistic that measures a player's value above replacement level.
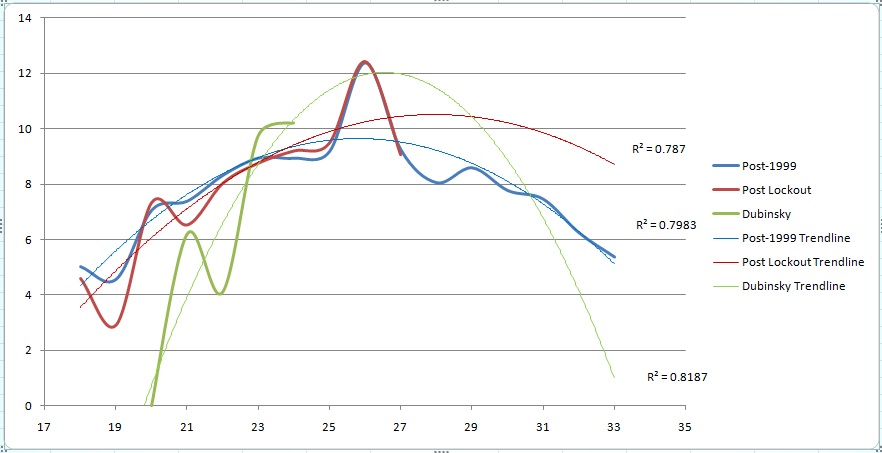
You'll see I also added a third group here, which is post-1999 season comparables using the same criteria, ages 22-24, 200 games played, between 0.51 and 0.71 points per game. This added Radek Dvorak, Patrick Marleau, Michal Handzus, Mark Parrish, Mike York, J.P. Dumont, Jochen Hecht, Brenden Morrow, and Kyle Calder to the above group. The addition was necessary to help smooth out the trendlines, and also give a better picture of the post-prime years.
The two comparable groups are fairly close in value (not surprising given the considerable overlap), showing an average peak at 26 years old of about 12.4 GVT, contributing around 10 over the course of the 'prime' years, and then tailing off around age 29-30. Brandon Dubinsky's trendline shows a much steeper ascent and descent, but the same general peak at around 12 GVT.
How does this translate to dollars? Rob Vollman showed that each GVT is worth $333k. Two years ago, that number was actually $344k, while last year it moved to $356k. Since GVT is by definition constant, it makes sense that as cap spending goes up, so would the amount spent per goal. With the cap increasing again this year, we could expect that number to in to increase again, to approximately $367k next year.
The trendline estimates that Dubinsky will be worth 46.67 GVT for the next 4 years, so at that spend rate, Dubinsky would be worth $17.129m over 4 years, for a cap hit of $4.28m per year. That number is right in line with the $4-4.5m that many have speculated he will sign for, given recent deals such as Andrew Ladd's. So we've shown that it would in fact be fair value for Brandon, as long as he continues to produce at the rate he's progressing to. If he follows the trend of Ryan Kesler (35.1 GVT over the last two years), he could actually be a considerable bargain.
The question is, will the Rangers feel the same way? Tell us what you think.
Special thanks to Tom Awad for making the GVT data readily available to the public.