Rangers vs Hurricanes Game 5 Stats & Analytics Recap

If it wasn't said enough already, Game 5 was a tough game to lose after a really tough third period. The Rangers will now have to go back to Raleigh on Thursday to try to close out the series in 6 games. There were a few positives to take away from Game 5, like a strong 2nd period where they had 6 SOG and won the xG battle. But expected goals only goes so far in the playoffs if you can't win all 3 periods, and the Rangers certainly lost the third.
The Rangers were finally better from the face-off circle, where they won 66.7% of face-offs and Trocheck went 77.8% in the defensive zone, and 55.6% in the offensive zone. Limiting Jordan Staal to just 30% offensive zone wins was a big advantage for the Rangers, as that has allowed the Canes to sustain pressure and throw as man shots on net as possible. This could be one of the reasons the Rangers were able to hold the Canes to just 67 total shot attempts, their fewest in any game this series. Still, the Hurricanes outshot the Rangers in unblocked attempts 42-31 and 28-21 in shots on goal.
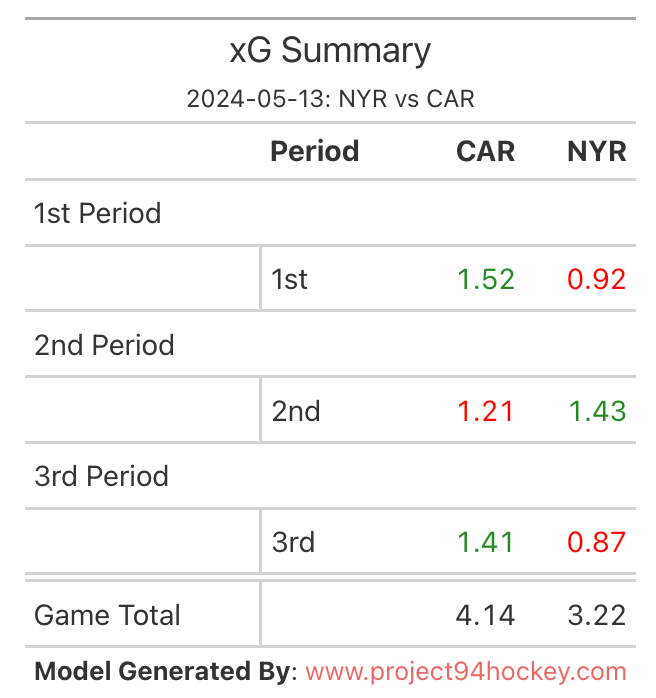
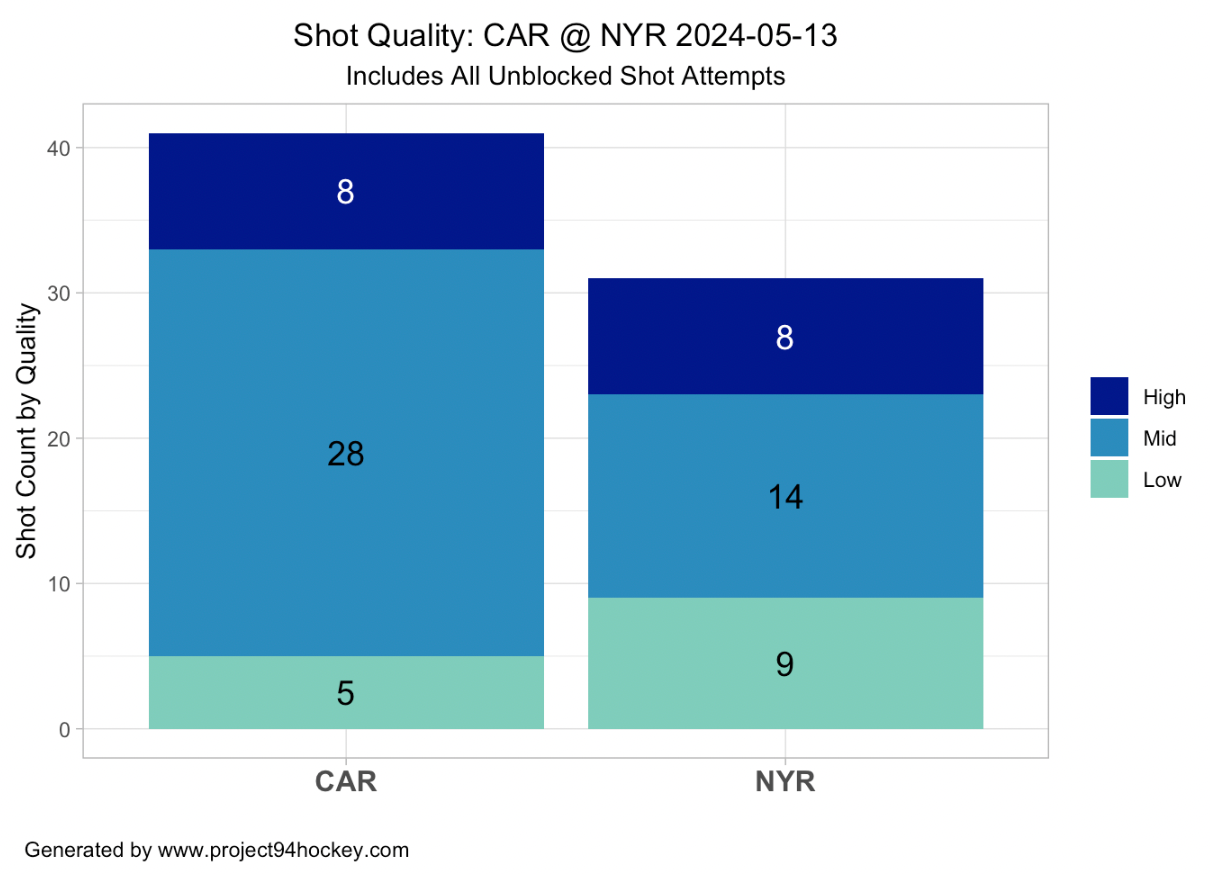
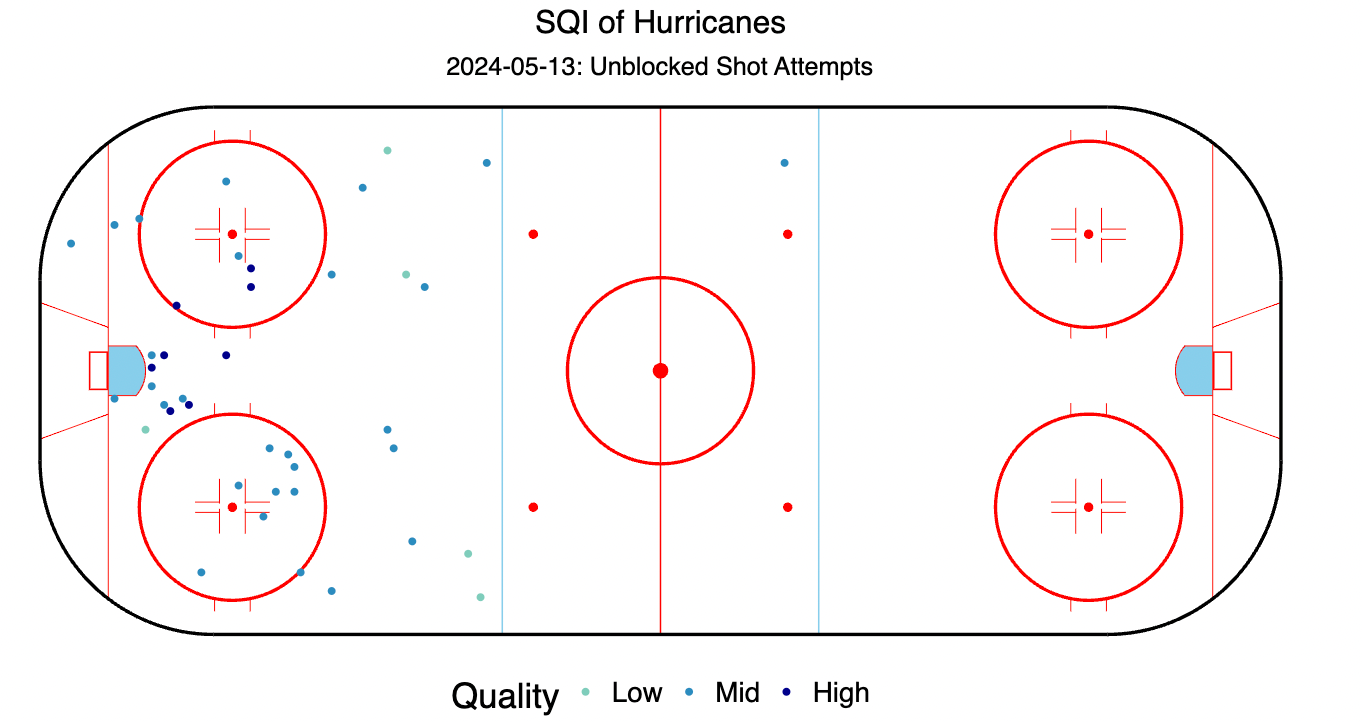
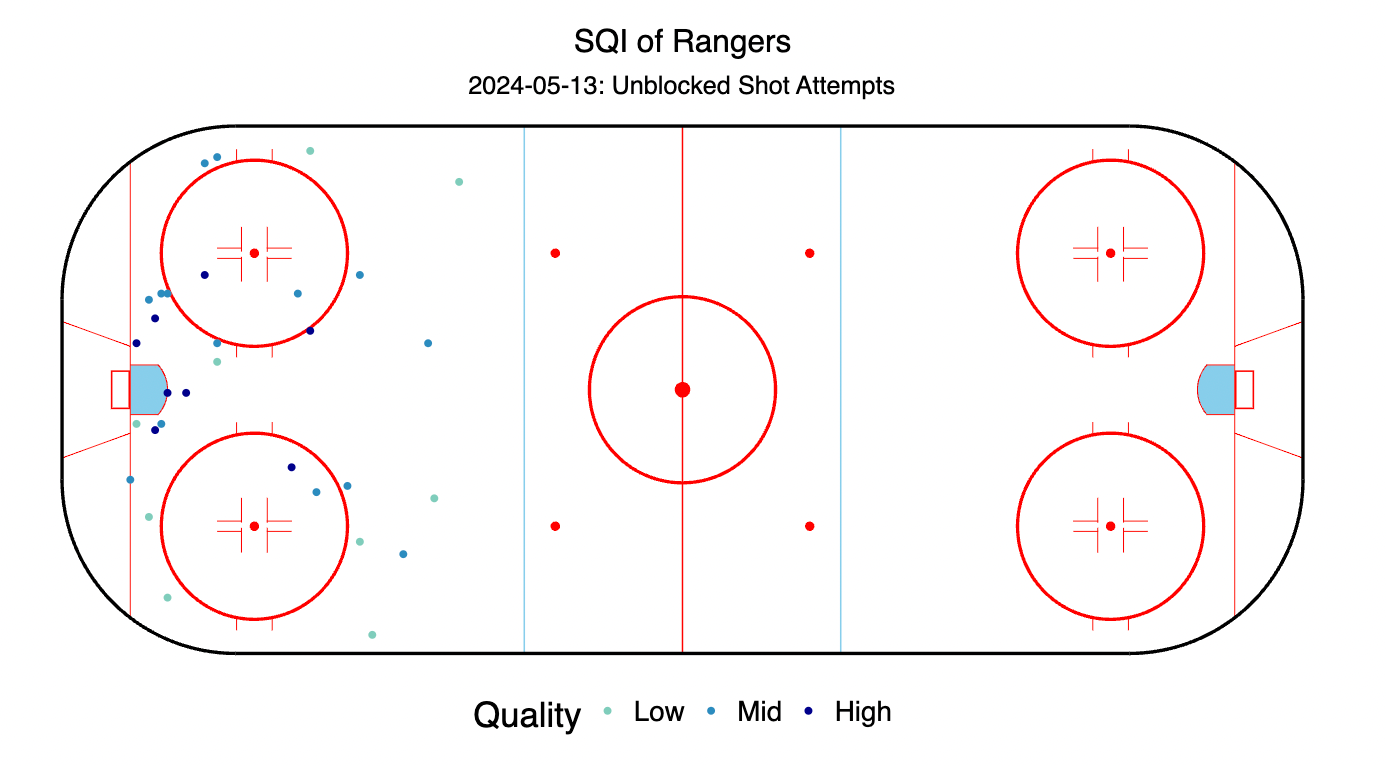
The Rangers were also able, as they have been all series, to match Carolina's high quality shot attempts, going 8-8 in Game 5. But, it was the third period when the Rangers were really outplayed, with a 1.41 expected goals against. The Rangers had only 1 SOG from the slot and while they had 4 from low areas, 2/4 were from bad angles. Looking at the shot maps below, it's clear the number of chances the Hurricanes got in front of the net compared to the shots that got push to worse angles for the Rangers.
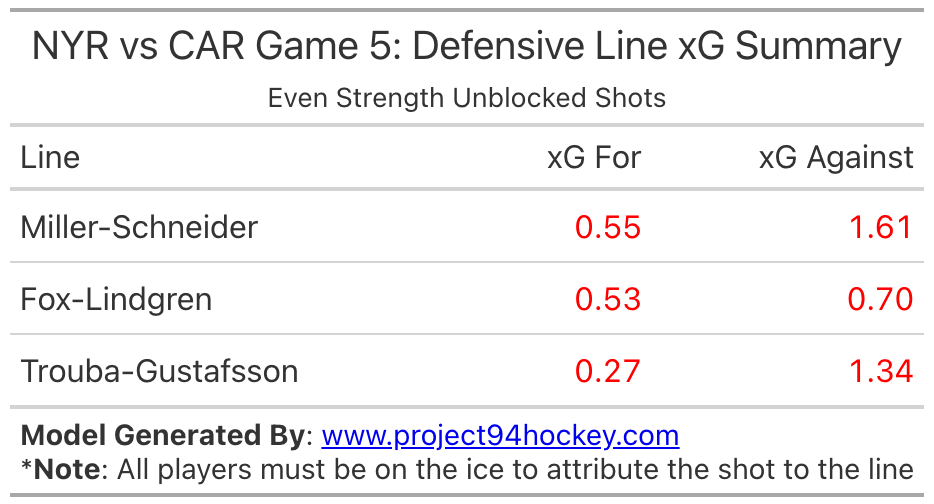
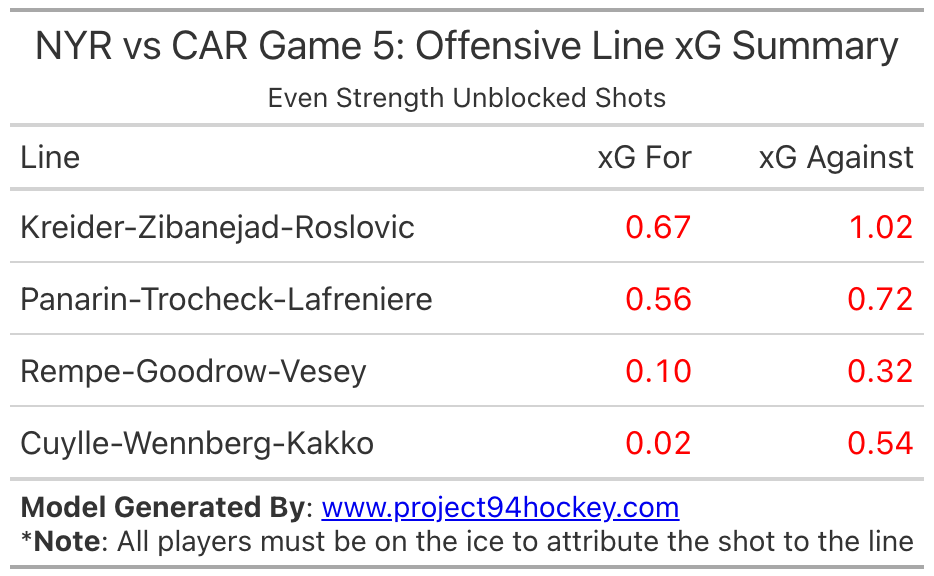
As for the defensive pairing performance, it was a rough night for both pairs that don't include Adam Fox and Ryan Lindgren, as the top line limited their opponents to an xG of 0.7 at even strength. But Miller-Schneider and Trouba-Gustafsson had low net xG, as they allowed 1.3+ expected goals against each, Miller and Schneider being on the ice for 2 actual goals (not including any empty net goals). Another line that stuck out as not producing is the Panarin-Trocheck-Lafreniere line, as they only had 0.56 xG For, compared to their 1.31 xG For per Game in the first 3 games.
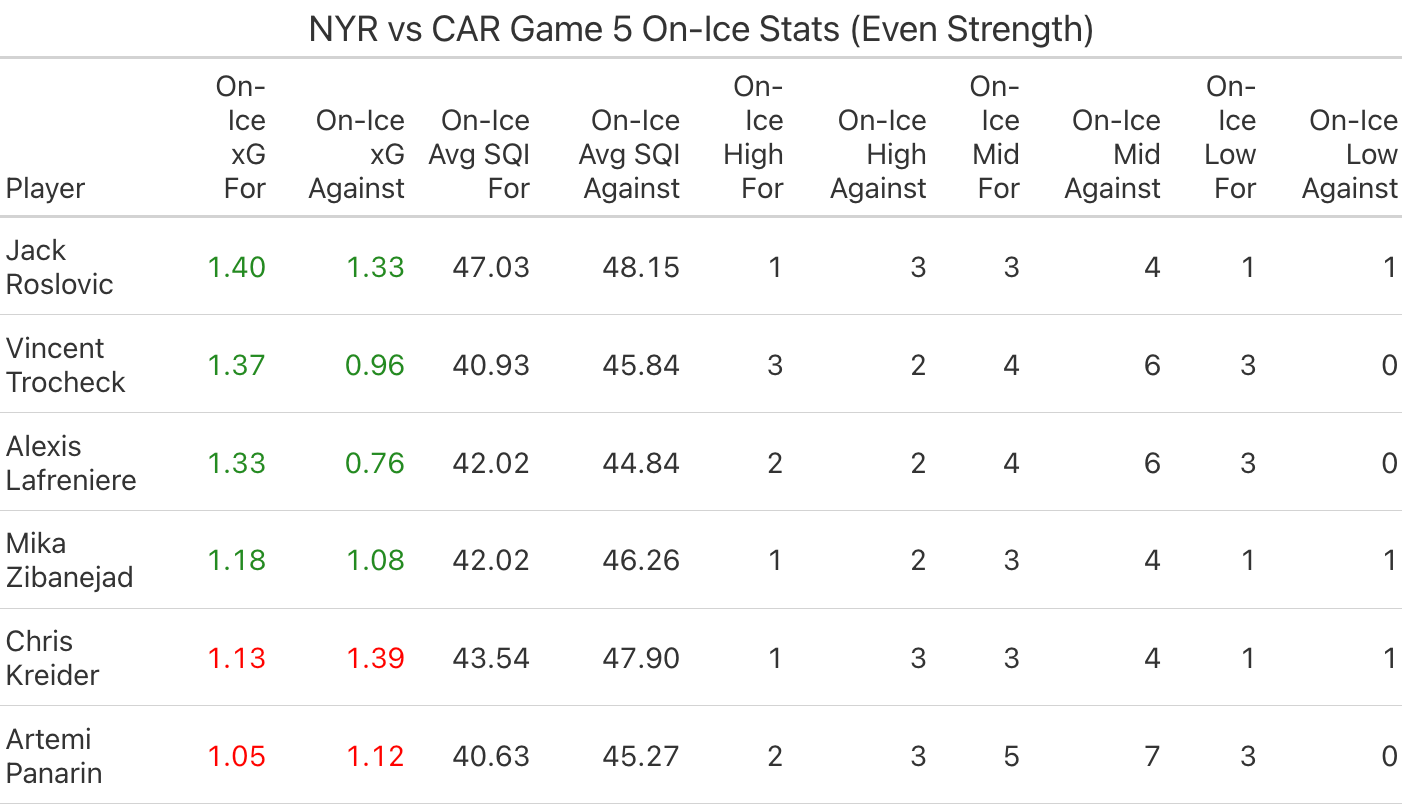
Judging by the eye test as well as the numbers, Jack Roslovic provided a ton of energy for the offense, leading the team in on-ice xG For with 1.4 at even strength. But most of the shots that added to 1.4 came from mid-quality shots as Roslovic, Zibanejad and Kreider were on the ice for only 1 High Quality Shot. Moreover, only 4 players (highlighted in green below) had a positive net xG. And even with those chances, Frederik Andersen posted 2.22 Saves above expected.
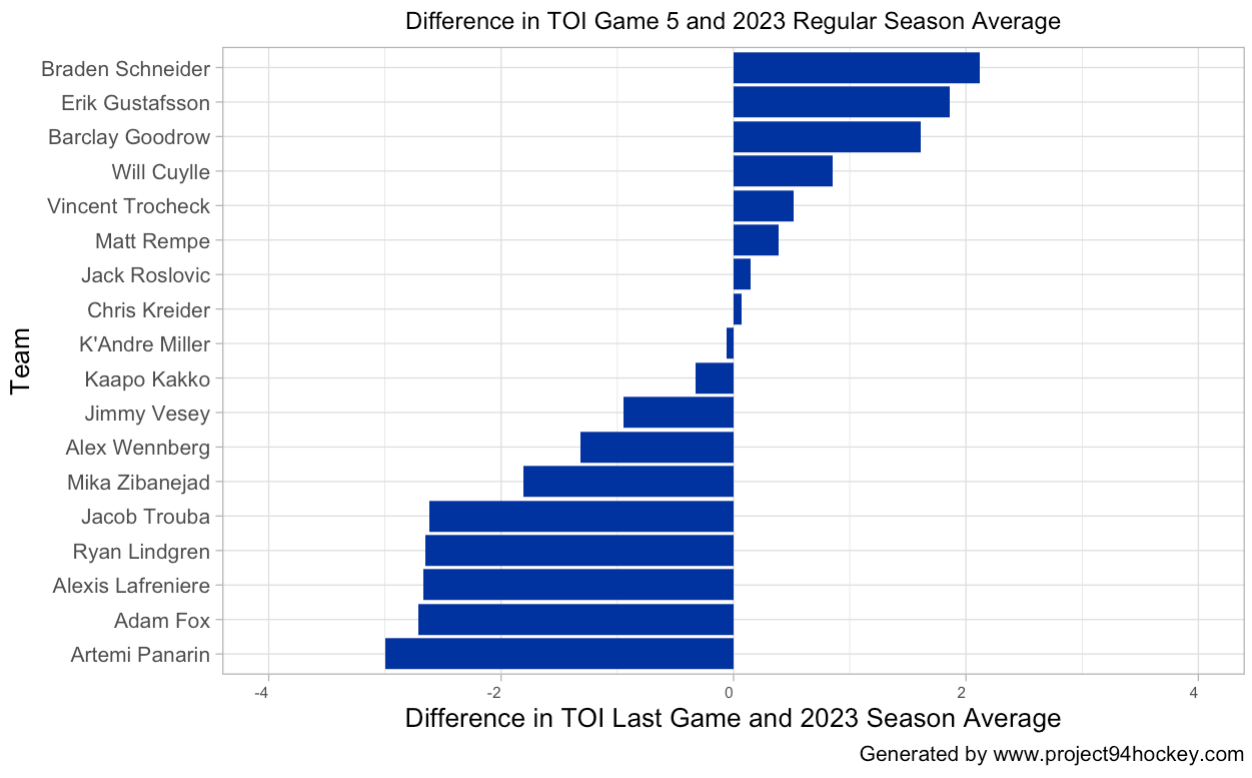
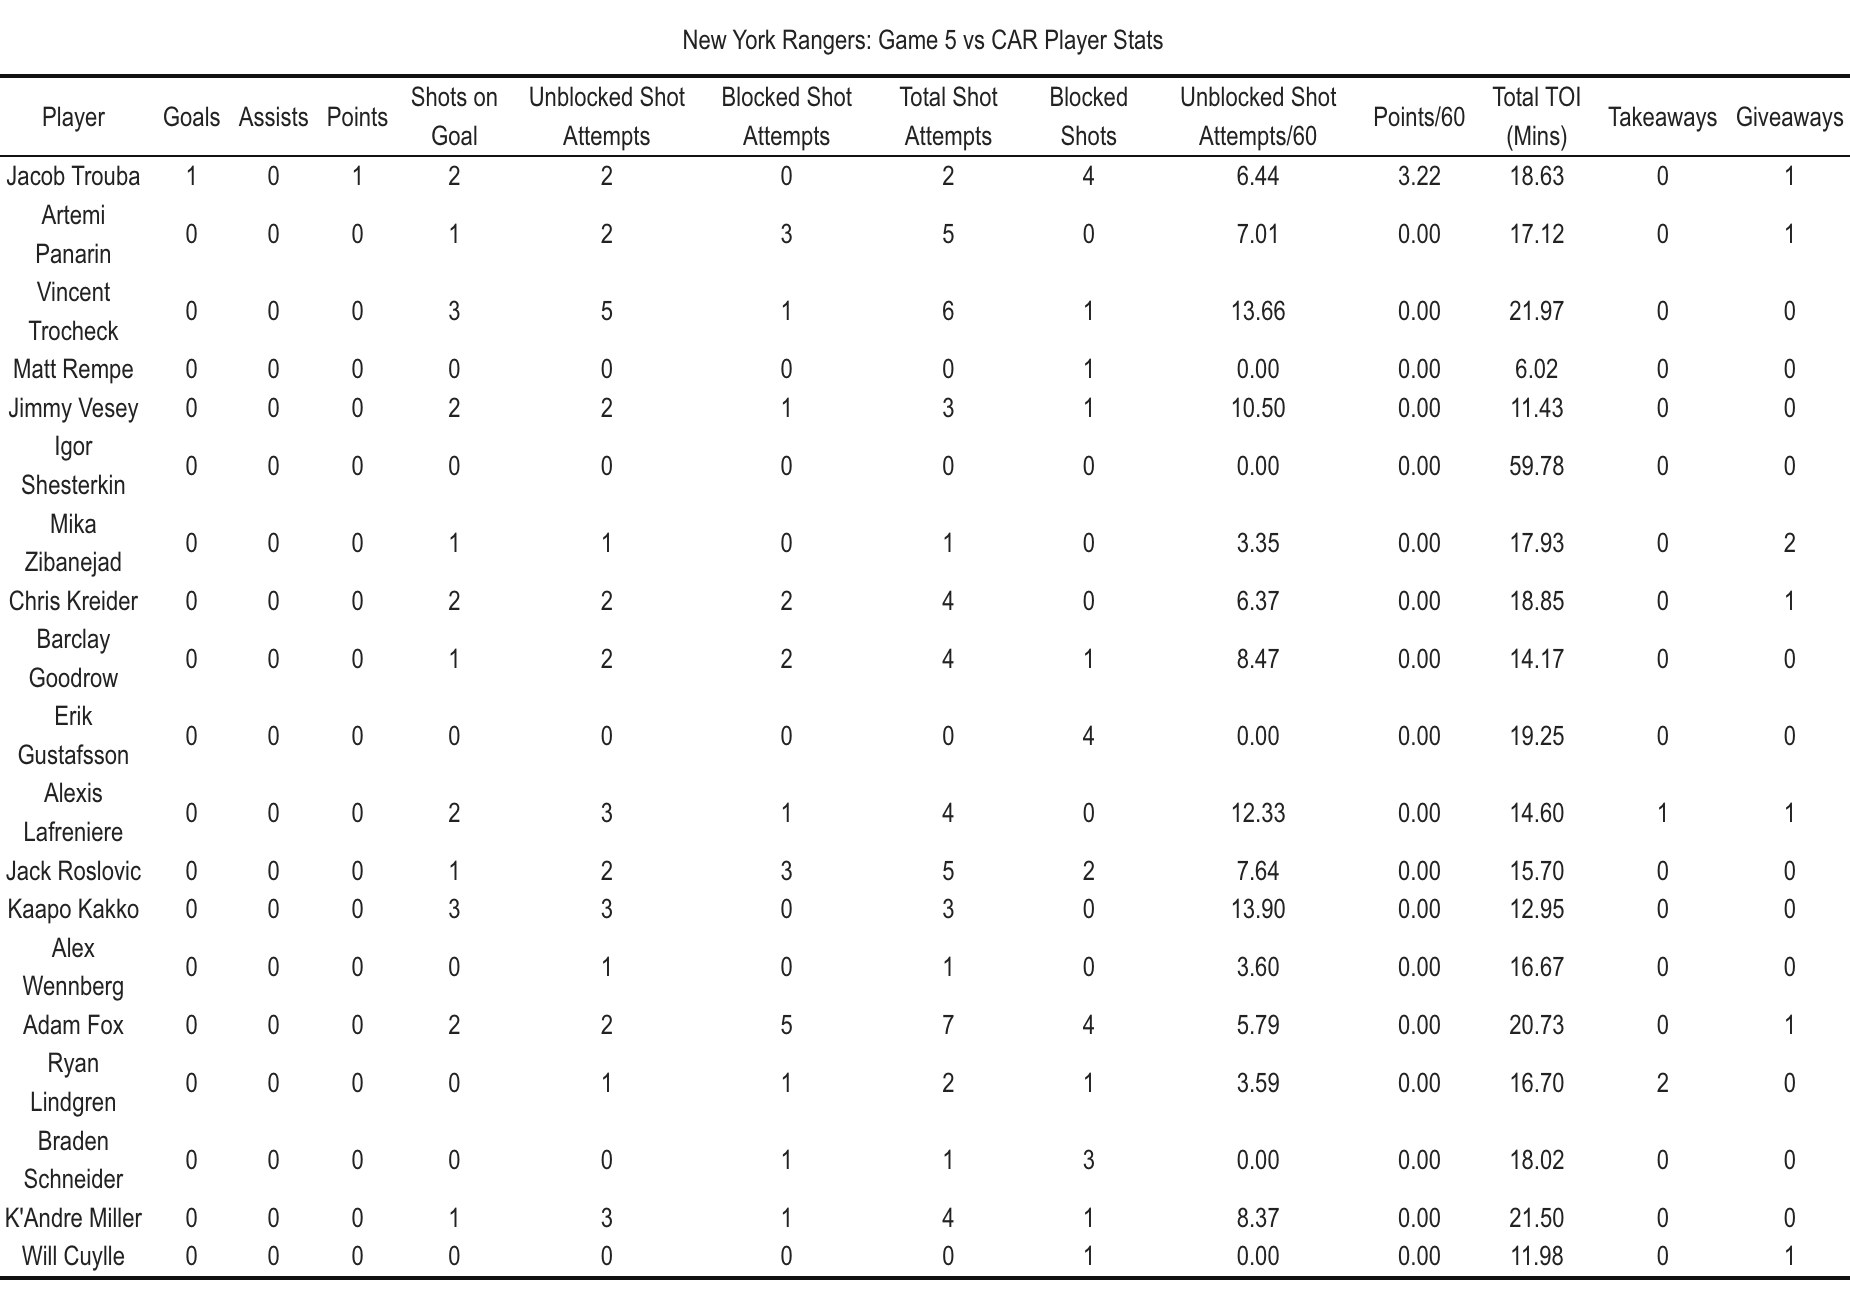
With just 21 SOG, all metrics point to the Panarin-Trocheck-Lafreniere line to produce more chances. Panarin had 3 fewer unblocked shot attempts than his regular season average, which was very close to his performance in game 3. Lafreniere's positive numbers should not be ignored necessarily for Panarin, as he obviously is heavily involved in Lafreniere's performance. However, this team is built around their stars like Panarin and Zibanejad getting shots on net and scoring, and when one of them does not, there's a distinct gap in the team's total metrics.