The New York Rangers' Power Play Shooting
After looking at the Rangers' even strength shooting again, the natural progression is to follow that up with a look at their power play shooting. That starts by once again looking at the league wide statistics in the category (statistics as always courtesy of behindthenet.ca):
| PPS/60 | 2008 | 2009 | 2010 | 2011 | PP SH% | 2008 | 2009 | 2010 | 2011 | |
| Forwards | 9.645 | 10.323 | 10.403 | 10.435 | Forwards | 14.86% | 15.13% | 14.69% | 14.11% | |
| Centers | 9.105 | 9.991 | 10.297 | 10.423 | Centers | 13.50% | 14.43% | 14.59% | 12.16% | |
| Wingers | 10.021 | 10.549 | 10.479 | 10.443 | Wingers | 15.72% | 15.59% | 14.76% | 15.57% | |
| Defensemen | 9.026 | 9.965 | 9.835 | 9.467 | Defensemen | 7.89% | 8.03% | 6.89% | 6.87% | |
| Total | 9.440 | 10.205 | 10.219 | 10.120 | Total | 12.66% | 12.84% | 12.25% | 11.91% |
At even strength, we saw that shots on goal clearly favored the forwards, who had roughly 2.5 times more per 60 minutes than the defensemen. On the powerplay, that changes dramatically, with the separation between forwards and defensemen at less than 1 shot per 60. Considering the smaller sample of power play minutes (more than seven times less), we should expect the rates to have more volatility to them, however the shot rates are fairly stable over the last 3 years. Instead, we see that volatility appear in the shooting percentages from year to year, especially among the centers and defensemen.
Do the Rangers' power play woes translate here? Find out after the jump.
| TOI | Shots | PPS/60 | PP SH% | TOI | Shots | PPS/60 | PP SH% | |||
| BRIANBOYLE | 49.20 | 14 | 17.073 | 28.57% | DANGIRARDI | 161.60 | 38 | 14.109 | 5.26% | |
| ERIKCHRISTENSEN | 133.56 | 33 | 14.825 | 12.12% | MATTGILROY | 71.92 | 15 | 12.514 | 0.00% | |
| MARIANGABORIK | 181.04 | 41 | 13.588 | 14.63% | BRYANMCCABE | 226.46 | 36 | 9.538 | 2.78% | |
| ARTEMANISIMOV | 145.96 | 30 | 12.332 | 10.00% | LEAGUE AVG | 9.467 | 6.87% | |||
| RYANCALLAHAN | 186.60 | 35 | 11.254 | 25.71% | MICHAELDEL ZOTTO | 169.20 | 23 | 8.156 | 8.70% | |
| LEAGUE AVG | 10.435 | 14.11% | MARCSTAAL | 200.20 | 24 | 7.193 | 16.67% | |||
| VINNYPROSPAL | 81.20 | 13 | 9.606 | 7.69% | ||||||
| BRANDONDUBINSKY | 228.69 | 34 | 8.920 | 11.76% | ||||||
| ALEXANDERFROLOV | 95.46 | 12 | 7.542 | 0.00% | ||||||
| DEREKSTEPAN | 178.76 | 22 | 7.384 | 9.09% | ||||||
| WOJTEKWOLSKI | 147.46 | 18 | 7.324 | 5.56% | ||||||
| MATSZUCCARELLO | 102.90 | 10 | 5.831 | 0.00% | ||||||
| RUSLANFEDOTENKO | 51.48 | 4 | 4.662 | 25.00% | ||||||
| CHRISDRURY | 14.64 | 1 | 4.098 | 0.00% | ||||||
| CHADKOLARIK | 2.96 | 0 | 0.000 | 0.00%! |
Data for Wolski (PHX) and McCabe (FLA) is full season data. Players must have 0.5 TOI/60 to qualify.
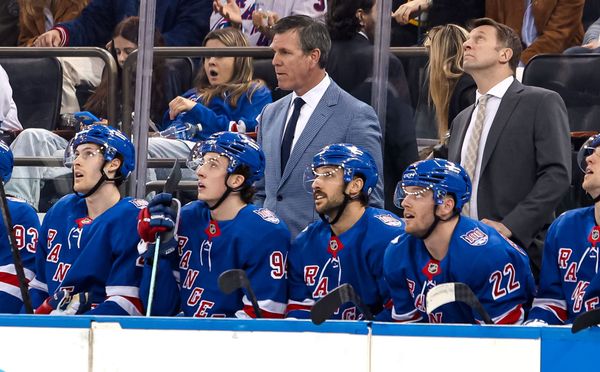
The name at the top of the list for forwards is the same as it was for even strength. Brian Boyle was doing an excellent job at generating his own shots on goal on the power play, but did so in limited time. Should that have been enough to earn him more? I think so, but the Rangers' coaching staff clearly did not. Just below Boyle, we see many of the characters that were given first unit time.
The lone regular not above average is your ice time leader, Brandon Dubinsky. This is actually encouraging to a degree, as Dubinsky led the team in scoring despite not really producing on the PP (his 2.63 p/60 was also well down the list of Rangers' forwards). You can never go wrong with room for growth. Finally, you see the impact that playing the point can have on a forward. The three 'projects at the point', Derek Stepan, Wojtek Wolski and Mats Zuccarello, were given a bunch of ice time, but not surprisingly, didn't generate many shots, posting below average totals even for a PP defenseman.
Speaking of the defenseman, Bryan McCabe was brought in to be the big shot that keeps the PK'ers honest. While he certainly brought the shot with him, he was basically average about unleashing it on goalies. As a whole though, the defense had a much better showing with regards to shots than they did at even strength. Dan Girardi, in particular, was very good at getting shots on net with frequency.
In a single season, there really isn't enough sample to make definitive conclusions about a players effectiveness as a powerplay player, but it it still important to remember how valuable power play time can be when it comes to scoring, and that players who can take advantage of that time are bound to have good seasons.