New York Rangers Stats: Scoring Chances Update
At the All-Star Break, the New York Rangers continue to sit at number 1 in the standings (at least by points percentage), and have shown no signs of slowing down. That's a far cry from where they were way back in October during my first update, where a slow start had people questioning a lot about the team. Now the only question is whether the team can still avoid the dreaded 'regression,' dropping like other teams of the past. As usual, Rob already covered that again with the shot metrics, so I'm just filling in the rest, with the season data on scoring chances.
Typically with these summaries, I start with the goaltending and then bombard the rest of the post with more tables. I just posted a lot of the data recently with the chance types, so for a change of pace, this time I'm going to instead bombard the post with pretty pictures charts. Here's one such chart:
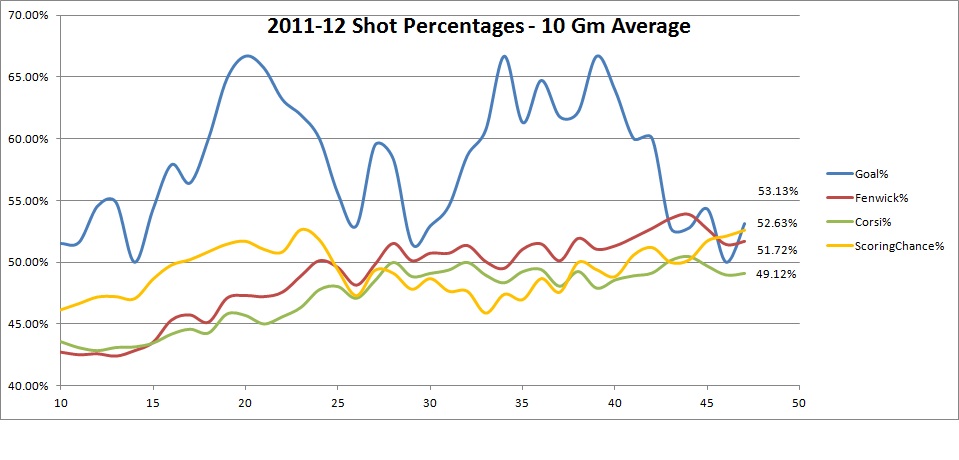
This will look familiar to a select few of you, as it is an update of one I posted a month ago. This shows the 10 game ratio of each of the important shot ratios, goals, Fenwick, Corsi, and scoring chances (all even strength data). For the most part, shots and scoring chances have been tied fairly closely all season, an indication that 'shot quality' is still not really a driving force for their domination in goals. That credit still goes to Henrik Lundqvist and Martin Biron. Even with the goaltending, it's important to get the better of the shots over the course of the year, as the correlation between goals or shots and scoring chances is quite high the later you get in the year. That 52.6% they're at now is perfectly acceptable for that goal, and where they need to remain.
After the jump, more charts!
On the individual level, I'll start with the now defunct GAS line:
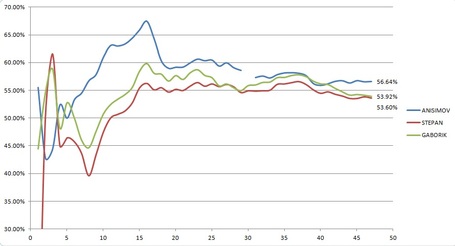
This group has been good to excellent all season, controlling more than 55% of the scoring chances while on the ice, led by whipping boy Artem Anisimov. Rightfully demoted for not bringing any offense to the line of late, Anisimov has still helped do the job defensively, limiting what has been allowed. Next up, the DRC combination:
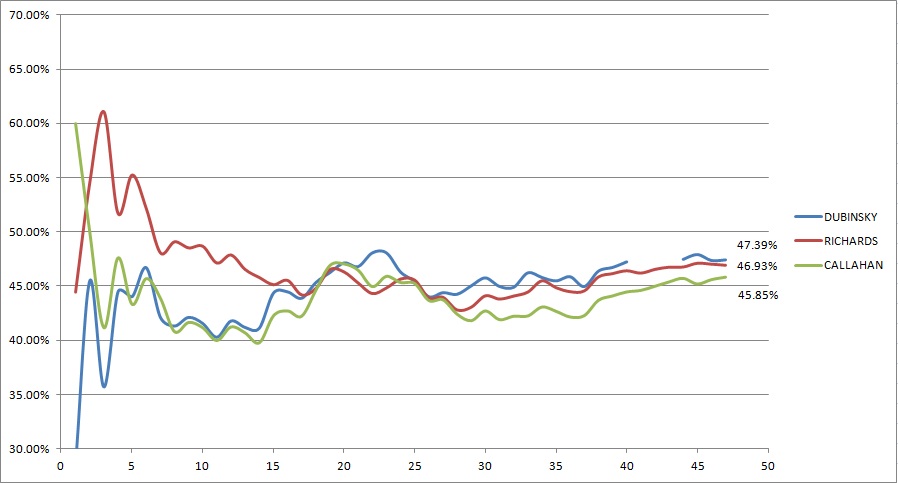
Taking on the highest level of competition among the forwards, this group has failed to break even on chances. While somewhat expected from Brad Richards, who is not known for his even strength play, Brandon Dubinsky and Ryan Callahan's level are a bit disconcerting. Of course, one has been doing well at generating offense when he does get chances, and the other has not. (I'll let you decide who is who). For the second half, you'd like to see either all three improve on these numbers, or have their competition lightened. They could do that by putting yet more defensive responsibility on the next group:
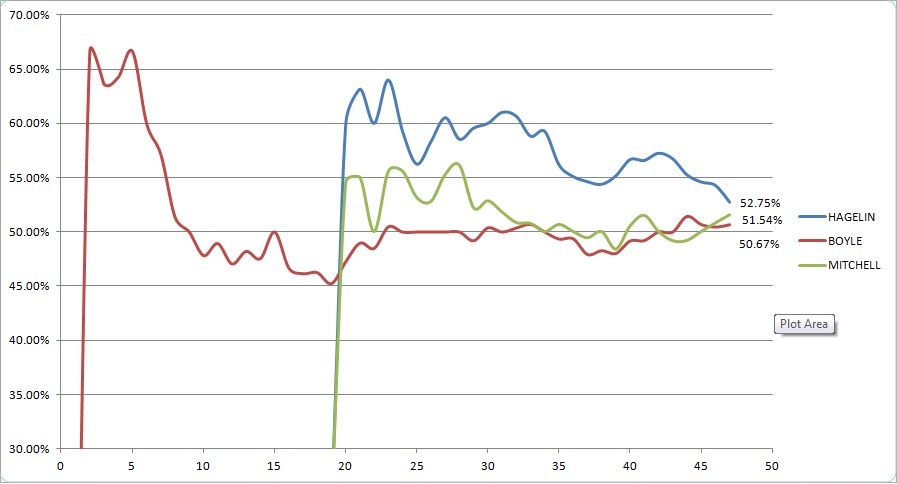
Carl Hagelin was nothing short of brilliant in the early going, for fifteen games, the team was getting more than 60% of the scoring chances with him out there. That number has since gone down as his assignments have gotten harder, but at 53%, he's still well above what could be expected from a rookie. You also see that the addition of Hagelin and John Mitchell clearly helped get Brian Boyle back into gear. Getting 50% of the scoring chances while only starting in the offensive zone 28% of the time is a tremendous job. He may not be scoring, but his defensive work has been worth every penny of his new contract.
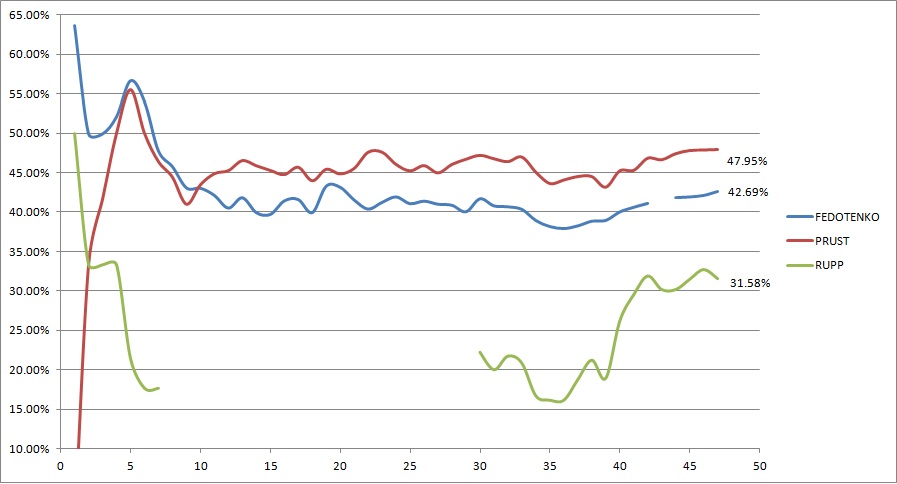
Our fourth liners have done what most fourth liners do, which is lose the battle overall. Prust has done a decent enough job, and given he has had some assignment with the top line, his level isn't too bad. Ruslan Fedotenko has struggled most of the year. His quality of competition still shows a high level of difficulty, coming from a long stretch where he was paired with Richards and Callahan against other top lines. Still, 42% is the worst number of any of the regular forwards, and a disappointing result after he had such a tremendous defensive year in 2010-11. Mike Rupp, well, he scored two outdoor goals against the Flyers. Past that, it has been, well, ugly.
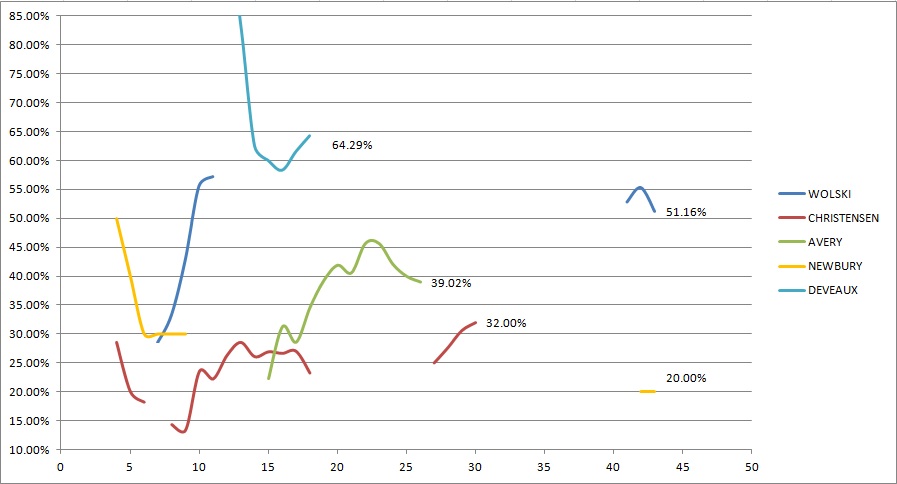
The spare parts look more like some kind of weird art piece than a scoring chance graph, but you can see the levels that each has played at for the course of the year. Andre Deveaux, if not for an errant elbow, surely had done enough to stay in the lineup, while Wojtek Wolski, with all the grittiness of a baby's skin, was at least getting a majority of the scoring chances in his limited action. The others are below 40%, which just isn't a passable level, and why all three have resided in the AHL for stretches this season. Moving to the defense:

The three regular defenseman this year have all been below 50%, not really a surprise when the team total is only 49.3% for the season. These three take the brunt of the defensive assignments, and while you'd hope for more, the upward trend lately suggests that they, like the rest of the team, are starting to really dominate.

Michael Sauer really is something else. Hardest competition on the defense behind Dan Girardi and Ryan McDonagh, and yet 55% of the chances are in the Rangers' favor with him out there. His recent setback is a bigger blow to the defense than some would realize, and his importance to the team can not really be overstated. The other injured players, Jeff Woywitka and Steve Eminger, both played good hockey against bottom 6 competition, controlling play in limited minutes. Both would be an improvement right now over Stu Bickel. Bickel has not been bad persay, but you don't want to see breakeven play from your bottom pair.
Of course, breakeven is a long ways away for Marc Staal right now. His struggles upon return are quite evident here. It is only a 78-event sample thus far (34 for, 44 against), so it will not take that much to get him back to respectable, but John Tortorella was right in scaling back his minutes again after letting Staal get a bit too active upon his return. He is simply not where he is expected to be right now.
Last and certainly least, here's a team look at the PP chances (excluding 5v3):
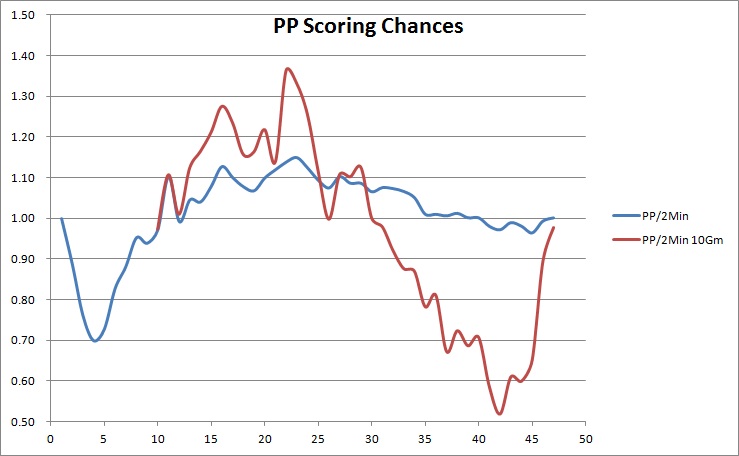
I don't think I need to explain that half a scoring chance per power play (or 1 every 4 minutes) is not a very efficient use of the extra man time. Overall, you can see how the PP has trended down for almost 20 games, getting fewer chances by the day. That recent uptick is solely courtesy of Andrew Ference and the extended 4v3 power play, so unless we plan on a new strategy of getting boarded in overtime, there's no reason for optimism there. From that, it's pretty clear that something needs to change, but that's a discussion for every other day.
Are charts like these better than just numbers everywhere? Leave me your thoughts on that or anything else in the comments.